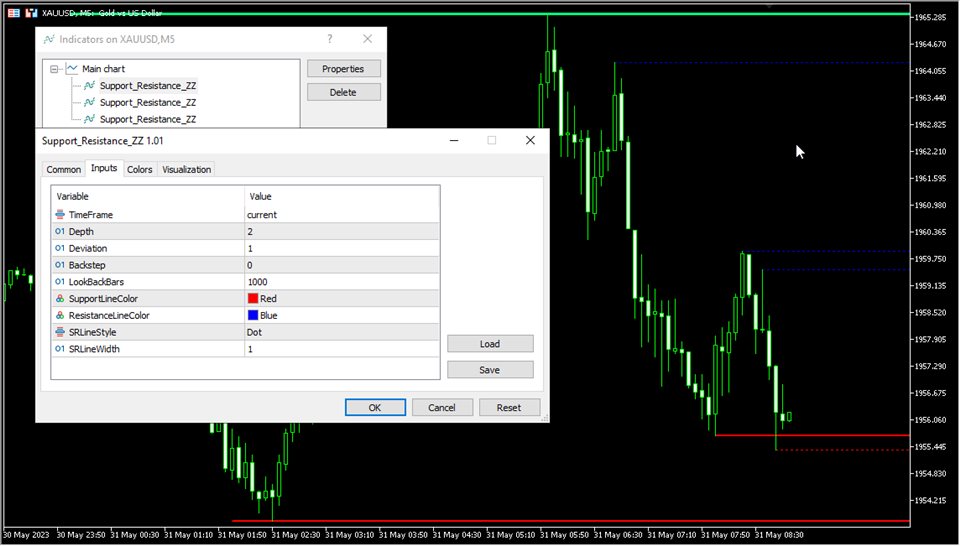
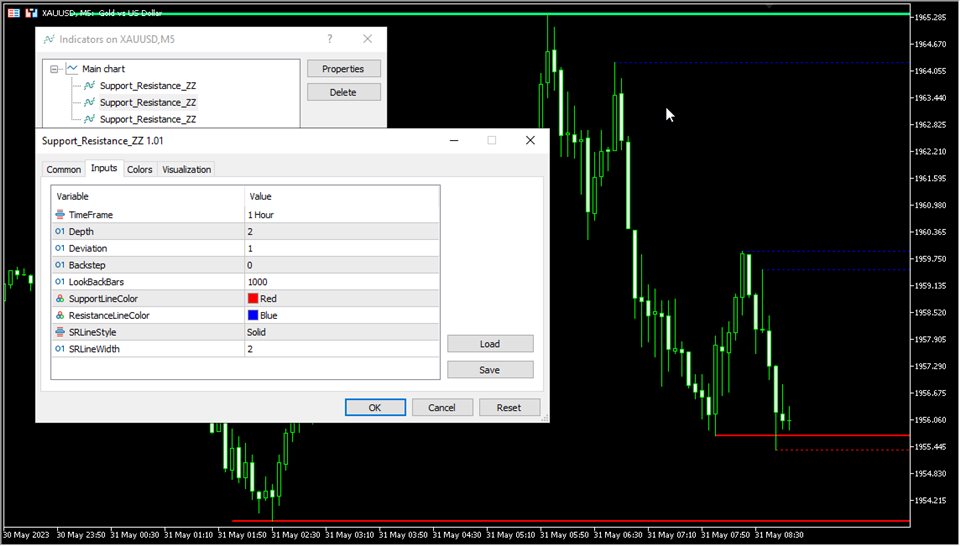
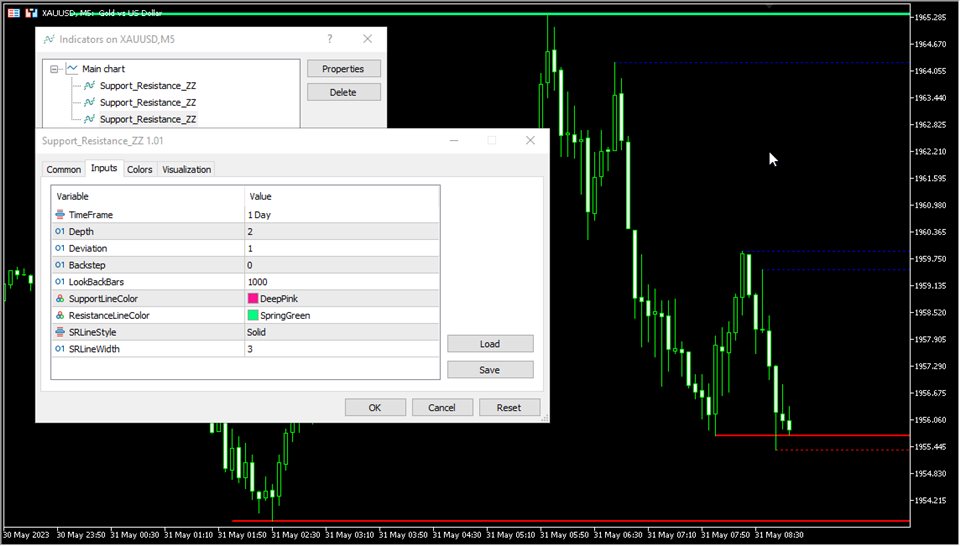
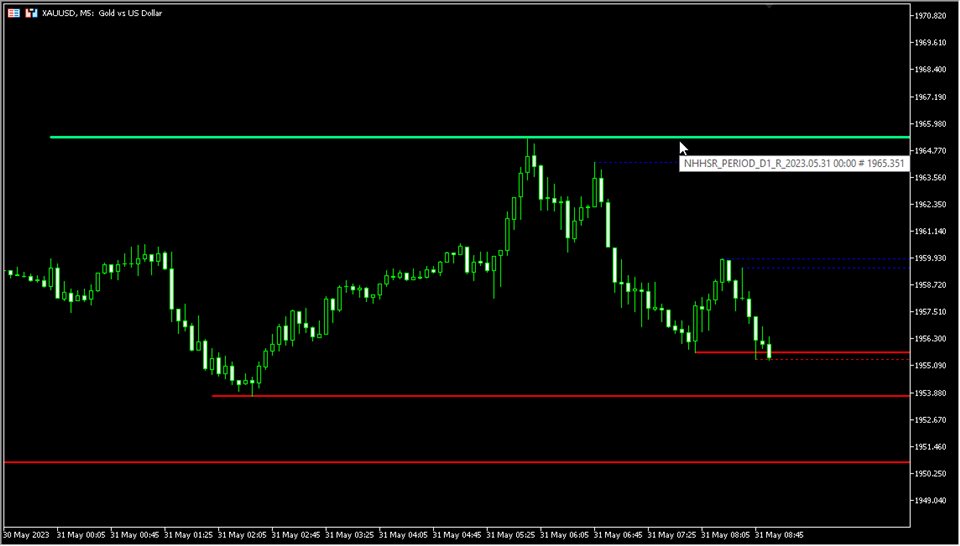
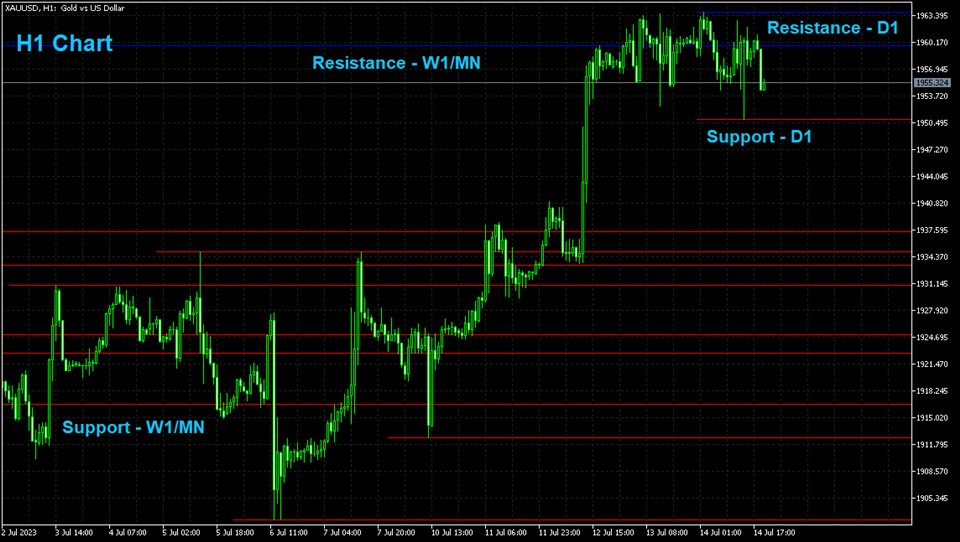
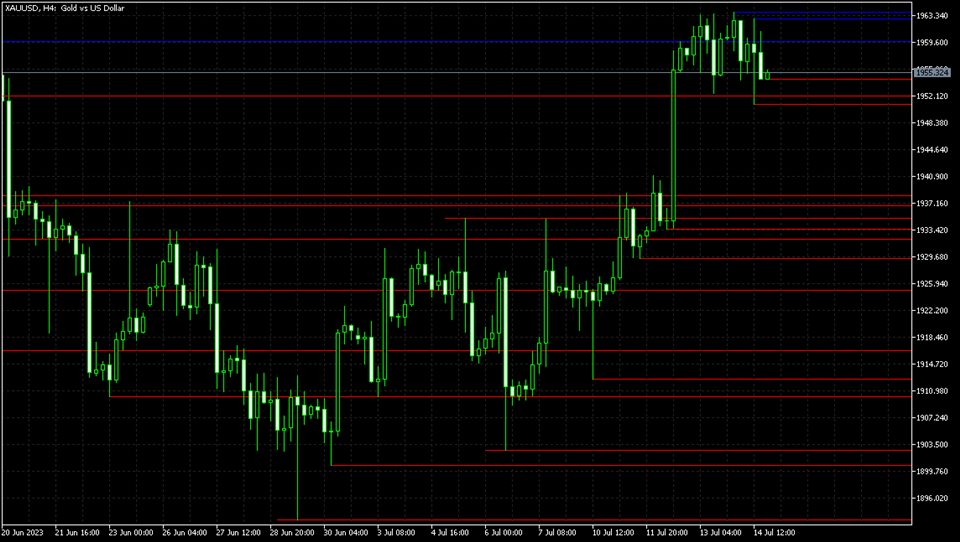
The MTF Support and Resistance Lines indicator for MT5 displays the support and resistance levels using the ZigZag indicator. The indicator only redraws when there is a new candle (according to the TimeFrame parameter). From version 1.2, the indicator added the function to determine support/resistance levels for 60 weeks and 60 months.
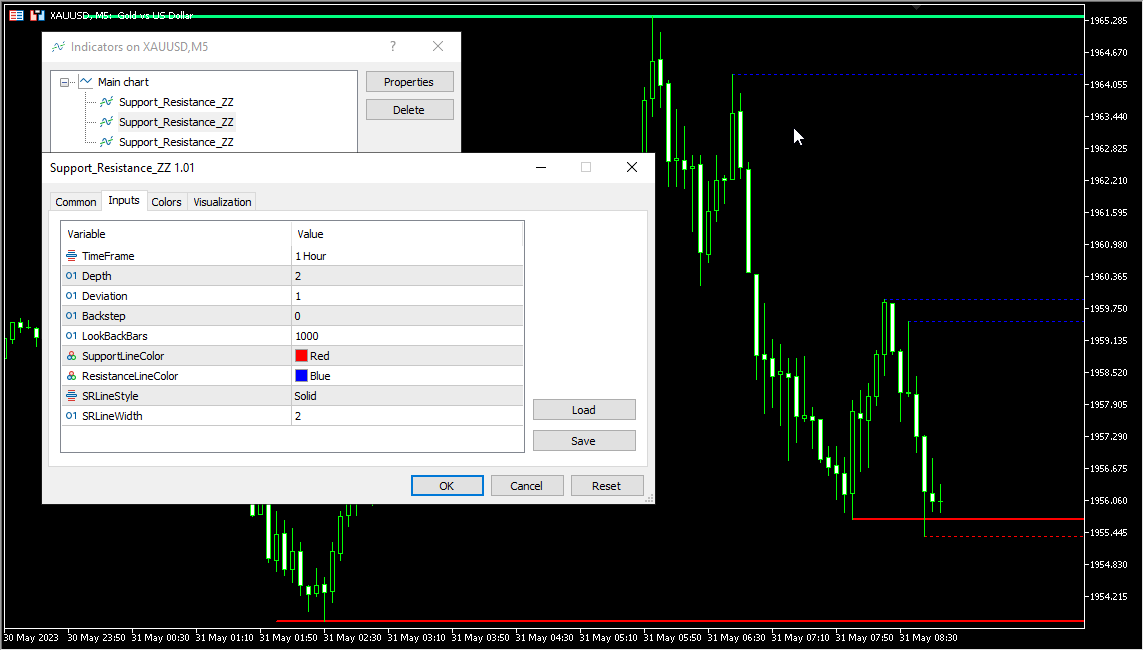
Input parameters
-
AutoDetectHTF - Automatically determine support/resistance levels for 60 weeks and 60 months.
-
TimeFrame - Timeframe to analyze. If the Timeframe is less than or equal to the current timeframe, the indicator will use the current timeframe.
-
Depth - Sets the minimum interval during which the ZigZag will draw a new extreme, if the Deviation setting is followed.
-
Deviation - The minimum price change in points required for the ZigZag to form a high/low.
-
Backstep - The minimum number of candlesticks required to separate two local extremes. Backstep must be less than Depth.
-
LookBackBars - Bars to analyze.
-
SupportLineColor - Color of the support lines.
-
ResistanceLineColor - Color of the resistance lines.
-
SRLineStyle - Style of the support/resistance lines.
-
SRLineWidth - Width of the support/resistance lines.

 The MTF Support and Resistance Lines indicator for MT5 displays the support and resistance levels using the ZigZag indicator. The indicator only redraws when there is a new candle (according to the TimeFrame parameter). From version 1.2, the indicator added the function to determine support/resistance levels for 60 weeks and 60 months.