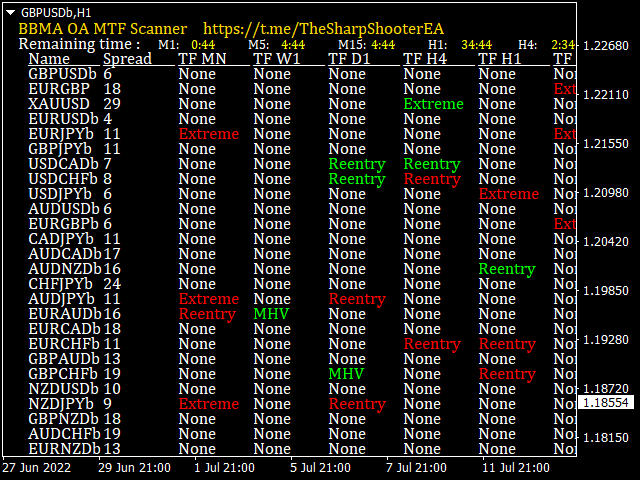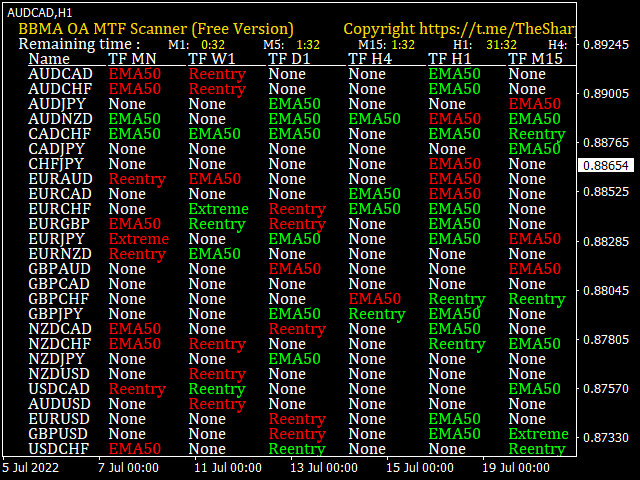
This is a Multi pair and Multi time frame dashboard. The founder of the system is Mr. Oma Ally, which is a system based from Bollinger Band and Moving Average(BBMA).
BBMA consists of the use of 2 indicators:
- Moving Averages
- Bollinger Bands
BBMA consists of 3 types of entries:
- Extreme
- MHV
- Re-Entry
- Rejection EMA50
This Dashboard Help you to scan current Extreme, Reentry setup, Rejection EMA50 and also MHV
How to read signals:
find the same color in 3 different timeframes in succession
For example:
1. The first timeframe must be reentry
2. The second timeframe must be reentry, extreme or rejected EMA50
3. The third timeframe must be extreme or MHVThe features of BBMA Dashboard :
- Scan latest CSAK(CSD) and CSM - When CSAK (CSD) or CSM is detected, it will scan reentry
- This indi will scan automatically the suffix or prefix pairs based on market watch list
- Update interval ( scanning interval - in seconds)
- Show timeframe as you wish
- Extreme and Reentry Signal
- RE-ENTRY: i s formed after the Rise/Fall of a price or market and the price
- market is now forming a sideways market for a Re-entry.
- Downtrend – MA5/10 High acts as resistance. Re-enter sell position when the market finds MA5/10 High. CS are under the MA5/10 High
- Uptrend– MA5/10 LOW acts as support. Re-enter buy position when the market finds MA5/10 Low. CS are above the MA5/10 Low
- Extreme - WMA5 out side of upper/lower the Bollinger Band
- MHV - Market failed to continue and couldn't break latest CSE