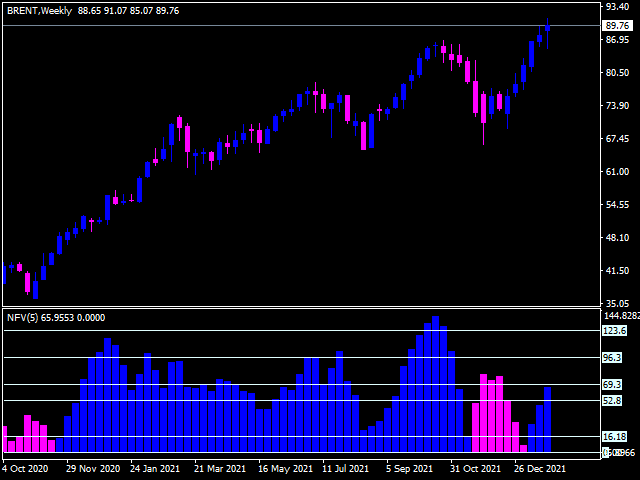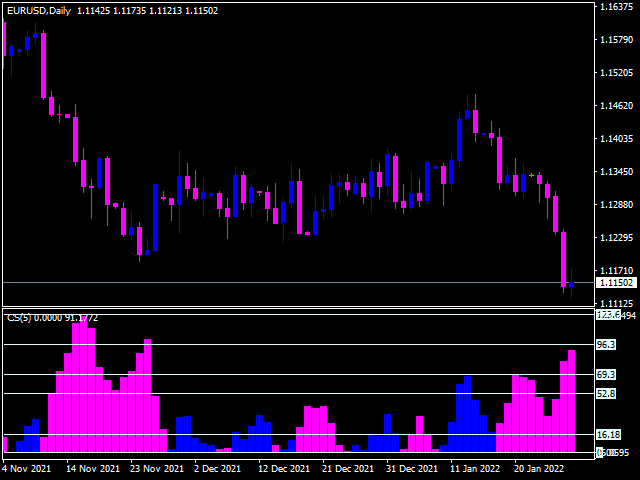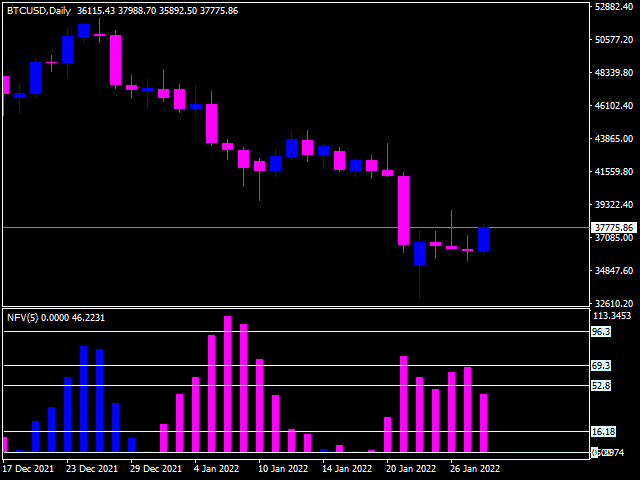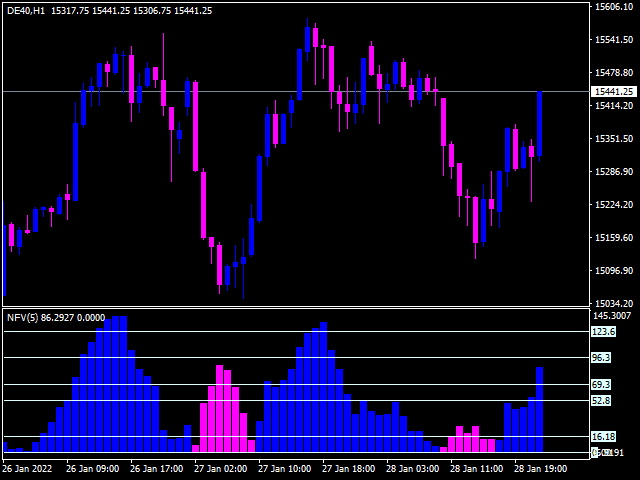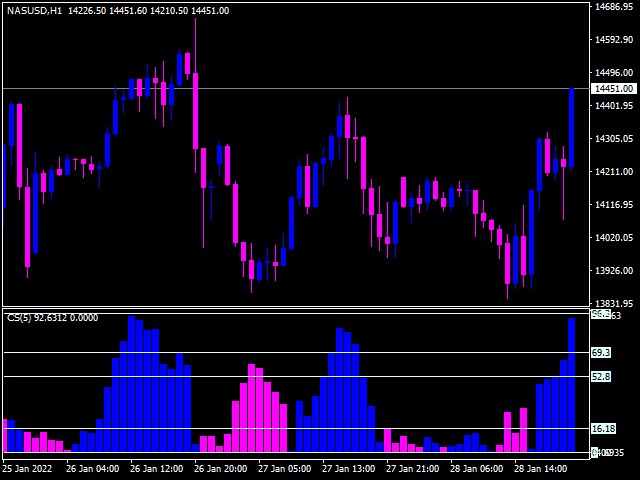
The indicator (Current Strength) is represented in a separate window by Blue and Pink histogram .
- The parameter NPeriod represents the number of bars on which we calculate the variation of forces, the recommended value is 5.
The Blue histogram measures the buyers force , while the Pink histogram measures the sellers force .
- The change in color signifies the change in strength which leads t he price .
- Each drop (especially below 52.8) after touching levels 96.3 or 1.236 must be condidered a very strong sign of changing direction!
A simple glance at this indicator and in parallel with the price movement gives a very clear impression that it is a tool to predict very early the change of forces acting in the direction of prices.
More details about this system: