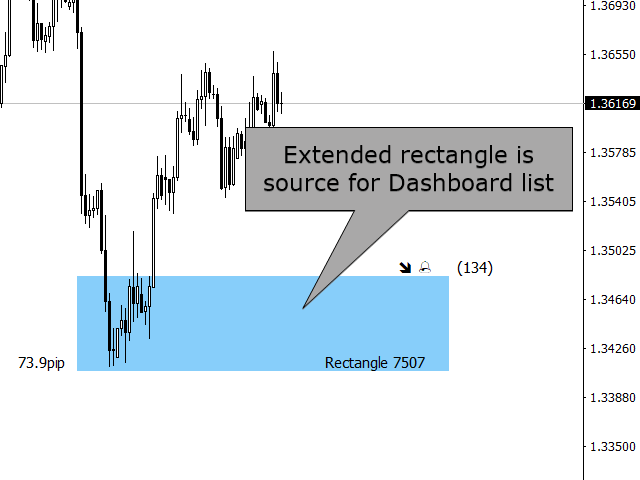
Display rectangles and trendlines list from Trading box Technical analysis tool. Objects are ordered in the list by pip distance that is difference between object price and Bid price. With this tool you will know which chart to look for next trading opportunity. No more switching between charts and searching for trades where price is close to rectangle zone or trendline support resistance level.
Sorted Rectangles and Trendlines by pip distance - If you are trading on multiple charts, then this functionality will save your time and you will no longer need to switch between charts all the time
Manuals here and watch YouTube video below.
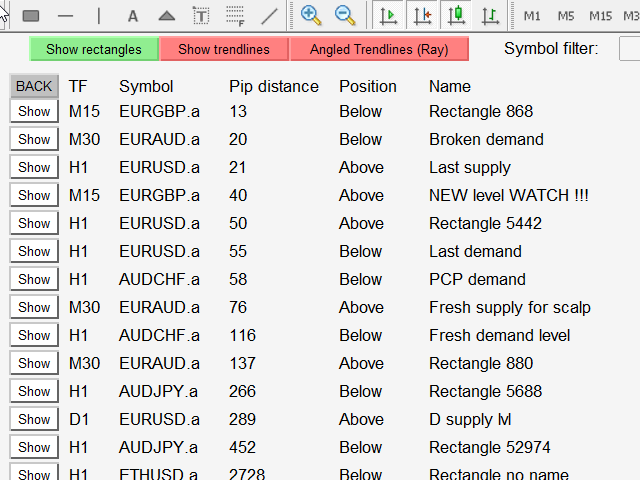
Display ordered list between 3 different objects types with 3 buttons:
- Show rectangles
- Show trendlines
- Show Angled trendlines (Ray)
- Price alert history
How to read Dashboard data
Show button = open symbol chart
TF (timeframe) = show timeframe of symbol chart
Pip distance = show pip difference between object price and Bid price
Position = object can be above or below Bid price. Rectangle also have Inside option.
Name = name of rectangle or trendline
Buttons = show which action buttons are activated for rectangle or trendline
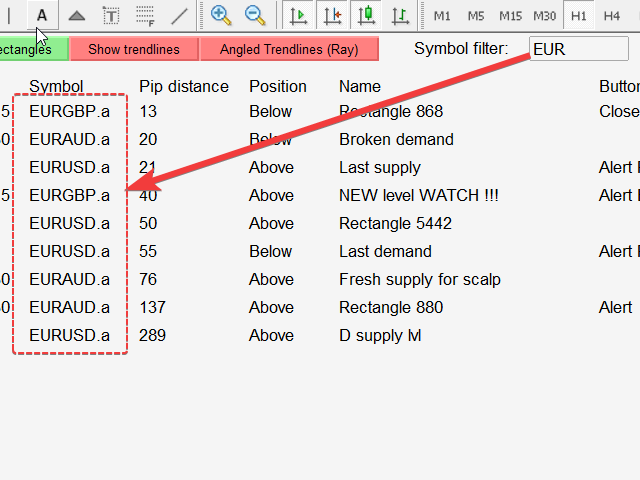
Symbol Filter = Enter symbol to filter charts in list
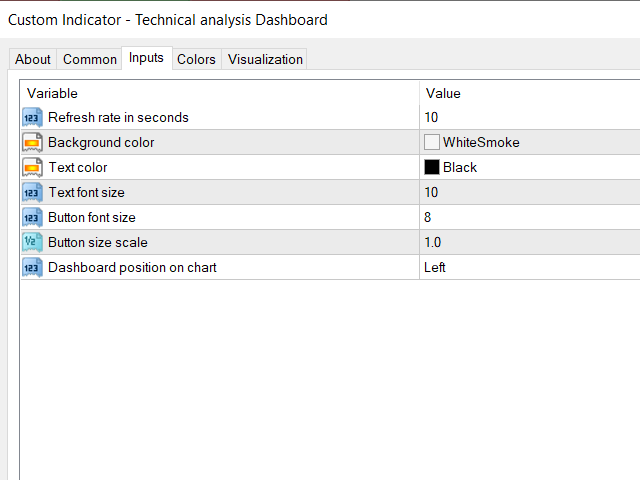
Trading Dashboard (rectangle and trendline overview panel and Trading box Technical analysis extension) Rectangle dashboard
It is important that you don’t spend too much time behind the charts because then you lose focus. This dashboard gives you an edge in forex trading because in few seconds you can decide which pair and timeframe is worth to watch more closely. This is how you will not be distracted by all other forex pairs that you trade, and you will not miss great opportunities to trade the best price. Most of the time traders watch only this dashboard and they decide which symbol they need to watch more closely for opening new trades. Technical analysis Dashboard is support resistance supply and demand monitor for market overview.
Find contacts and manual links on my mql5 profile .
TRADING BOX group chat and channel .
Rectangle extender, order dashboard, order panel, trading panel, trade assistant, trade manager, supply demand, fx power, price action, entry points pro, trade scanner, scalping dashboard. This extended rectangle or Zone Extender can be used like color level or color levels advanced rectangle tool. It can be used as order block rectangle alert. Many traders use it as consolidation box for breakout alert or break alert. Trend alert and Line alert is very useful. It works nicely with Forex Trade Manager, Trade Assistant, naked forex, Easy Trade Manager, Draw Horizontal Ray, Smart Ruler, Order Block Breaker, Quick Order Tool, email price alert, Smart Rectangle Extender, Risk Reward Ratio Calculation, TBTA, FX Trend, FX Power, Entry Points Pro, FX Volume, Advanced Supply Demand, pip counter, breakout alert, Market Reversal Alerts, tradepanel, orderblock, support and resistance, true price action, trade copier, pipfinite, candle timer, pivot points, ICT, SMC, Smart Money Concept, Support and Resistance, Trend Analysis, Price Action, Market Structure, Order Blocks, BOS, CHoCH, Fibonacci Retracement, Multiple Time Frame, Market Structure, Liquidity Voids, Candle Timer, Fractals, ZigZag, Time Zone, Market Sessions, Break of Structure, Change of Character, Smart Market Structure Concepts