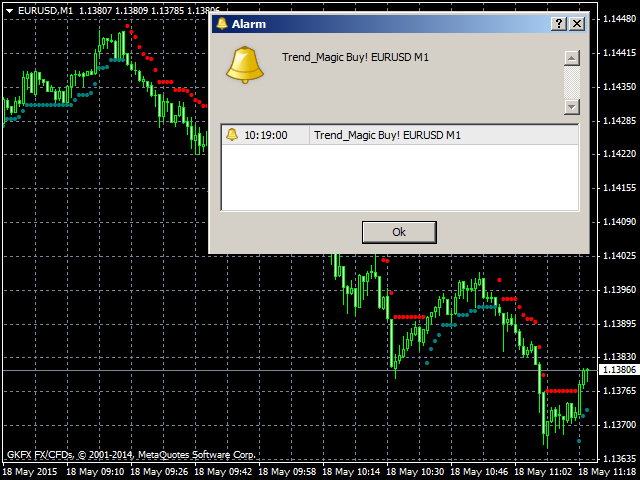
The Trend Magic Alarm shows the direction of a trend and indicates when it changes with a sound, popup window, push or email notice. Blue dots in the chart indicate an uptrend, red dots indicate a downtrend.
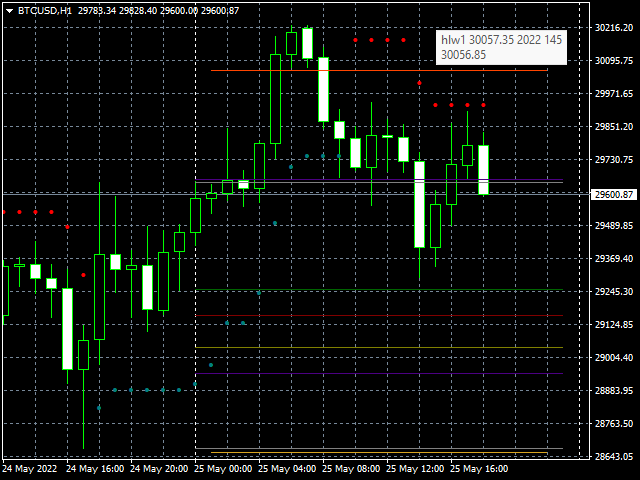
Levels of former highs + lows give orientation in a chart. Trend Magic Alarm can draw these levels as lines in the chart, see inputs.
Input Parameters
- Counter : number of bars used for calculation
- PowerSet : shows how near to the bars the trigger dots are placed
DotSize : size of the shown dots
PopupAlarm : Alarm can be de/activated
SoundAlarm : Alarm can be de/activated
EmailAlarm : Alarm can be de/activated
PushAlarm : Alarm can be de/activated
Text_Buy : Text shown in Alarm
Text_Sell : Text shown in Alarm
Levels of former highs + lows give orientation in a chart. Trend Magic Alarm can draw these levels as lines in the chart.
A change of a trend on a indicated level is a strong signal.
ShowDays : Shows max. + min. levels of former days. Set=5 it shows last 5 days, 0 = disabled
ShowWeeks : Shows max. + min. levels of former weeks. Set=5 it shows last 5 weeks
ShowMonths : Shows max. + min. levels of former months. Max setting is always 5
By mouseover on a horizontal line it shows e.g.: hhw1 = h ighest h ight w eek 1
In screenshot 2 is shown the mouseover for hlw1 : h igh l ow w eek 1 = middle between highest high and lowest low of the week before
it also shows hld1 = m iddle between highest high and lowest low of the day before
hlm1 = m iddle between highest high and lowest low of month before.
Lines are drawn only on the current day, not on former days.
Note : Setting Trend Magic Alarm first time on the chart to show the lines it usually shows wrong levels, as the data wasn't there.
Just remove Trend Magic Alarm from the chart and set it on again, then it should show the correct levels.
The colors of the dots can be changed.
The indicator works in every chart and informs with a sound and a popup window when the trend direction changes, as shown in the picture below.