General
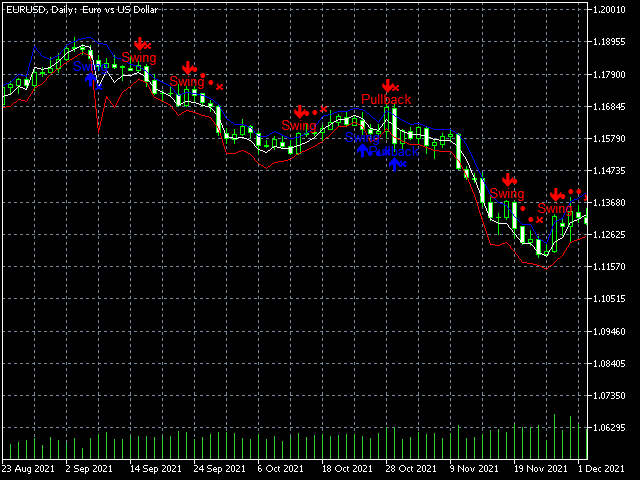
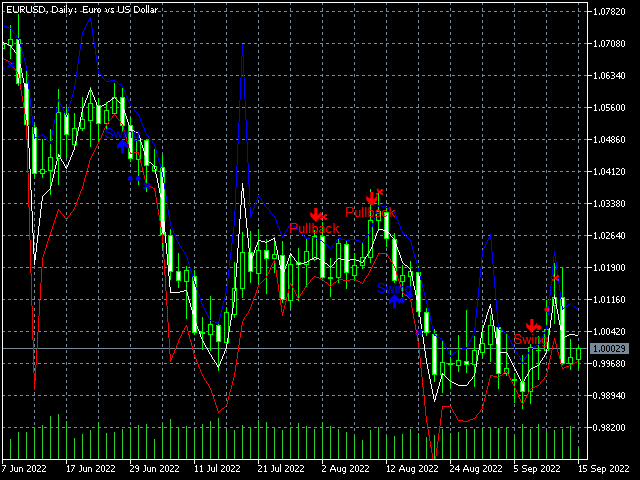
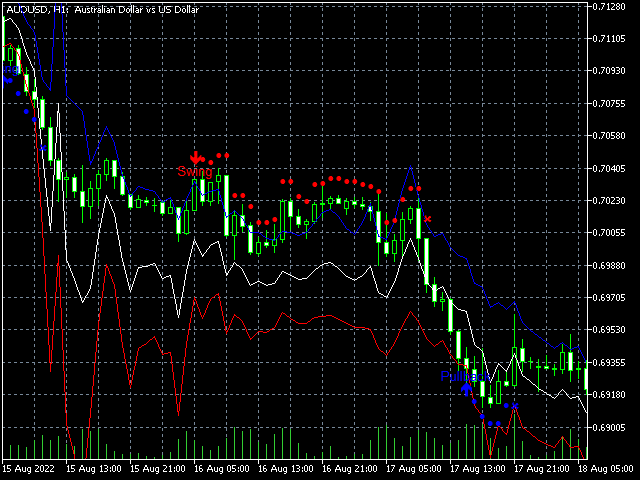
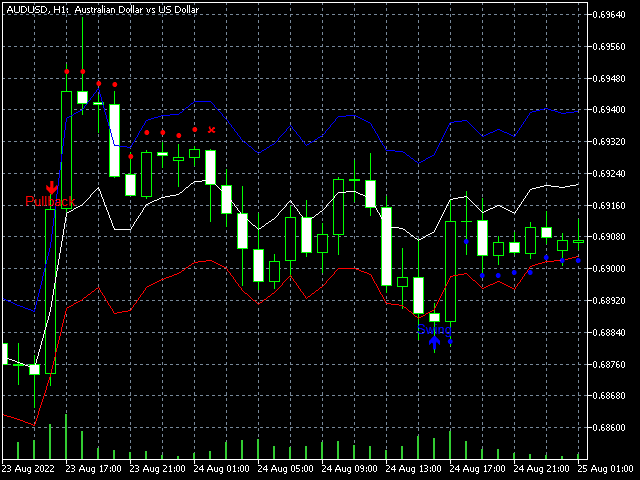
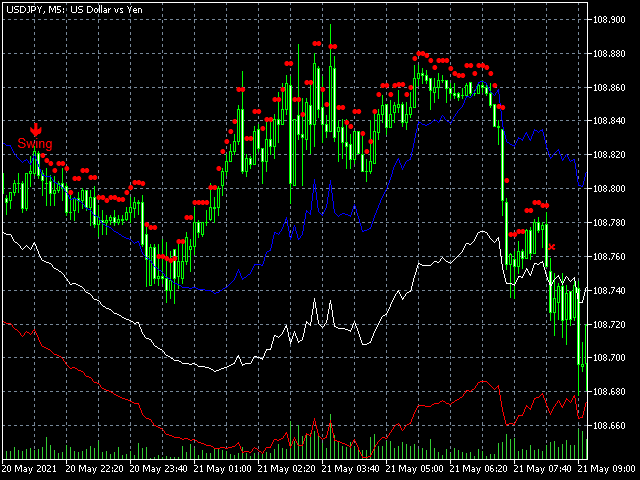
The Ornstein-Uhlenbeck process is one of the most important processes defined by a stochastic differential equation. It is used both in the natural sciences and in financial mathematics. The trending Ornstein-Uhlenbeck process is an advancement of the Ornstein-Uhlenbeck process. The difference is similar to the difference of the Bollinger Bands and the Linear Regression Bands. Assuming that the stock market price follows an trending Ornstein-Uhlenbeck process, this indicator determines the fair price and the fuzziness of this calculation, which is displayed as bands around the fair price. This should make it possible to determine the significance of a deviation of the current price from the calculated fair price.
Parameters
- Period: The number of values (e.g. bars) that should be used to calculate the fair price.
- Width: Multiplier for the width of the bands of fuzziness.
- MaxDeviationFactor: Specifies how high the deviation of the determined fair price from the current price is allowed to be measured against the standard deviation.
- ShowSignals: Specifies whether signals (Entry, Hold, Exit) are shown.
Explanations
Since overestimation of market movements can occur when calculating the fair price, which leads to strong fluctuations of the calculated fair price and increased fuzziness, the MaxDeviationFactor parameter was introduced. It should not be set too low, so that justified deviations from the fair price to the current price are not suppressed.
Ideas
Of course, everybody can come up with his own ideas of what to do with an indicator. But here I would like to pass on simple trading ideas.
1) The Reversal idea: If you set the Width parameter high enough, e.g. to 1.5, and the price rises above the upper band, this is either a signal for a very strong uptrend or for an overreaction. If the price falls below the upper band again, this can be seen as a sell signal.
2) The trend idea: if you set the Width parameter low enough, e.g. to 0.5, the market is in an obvious downward movement and the price is within the upper and lower bands, this indicates that the downward movement is stable at the moment and there is no overreaction provoking a correction. So, such a constellation can be seen as a sell signal.