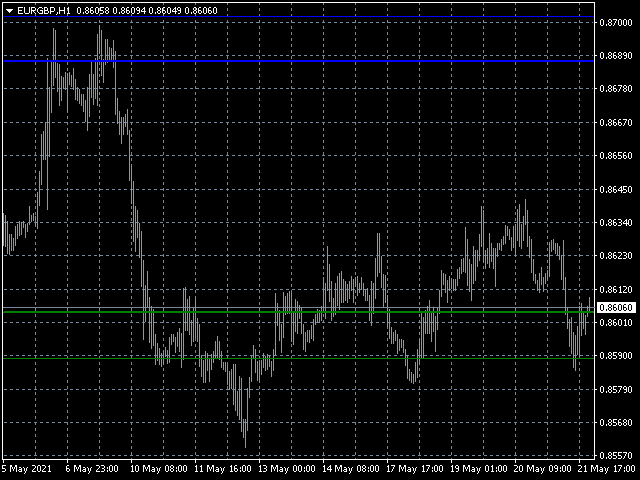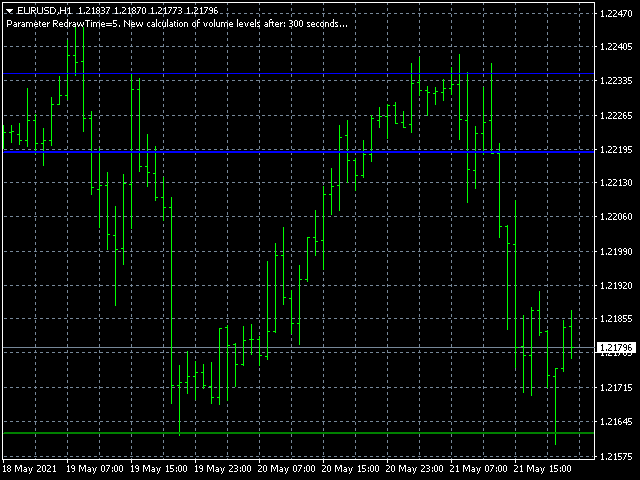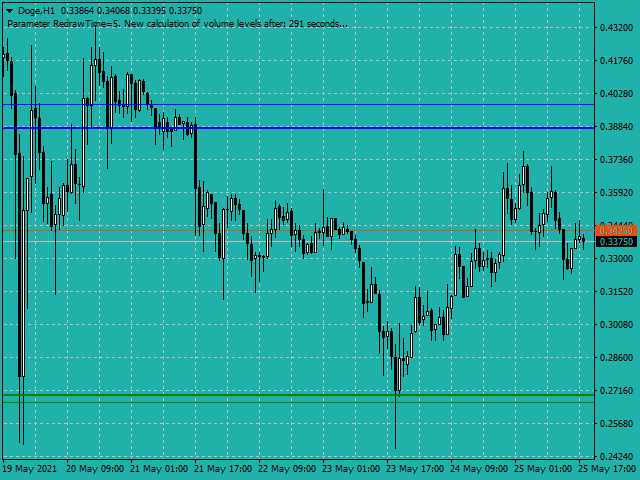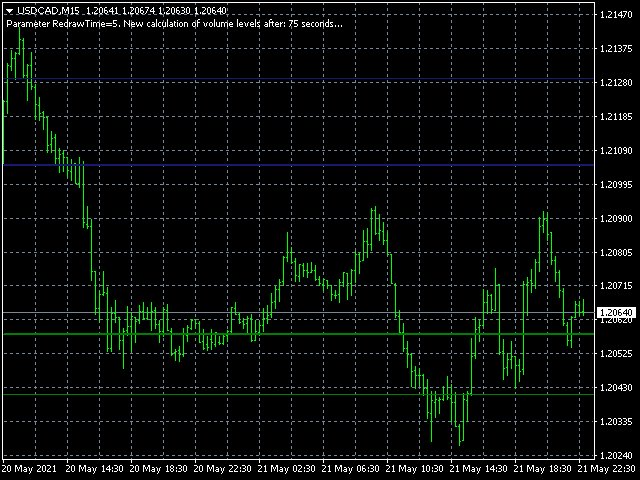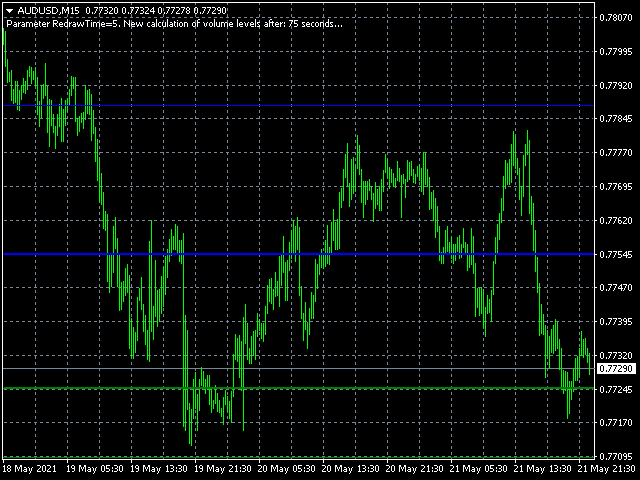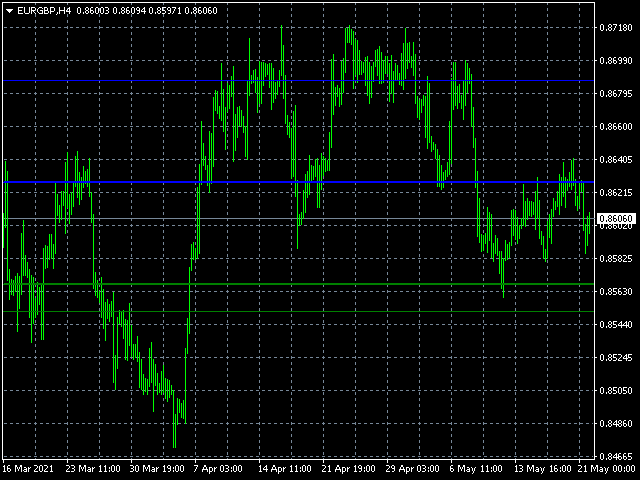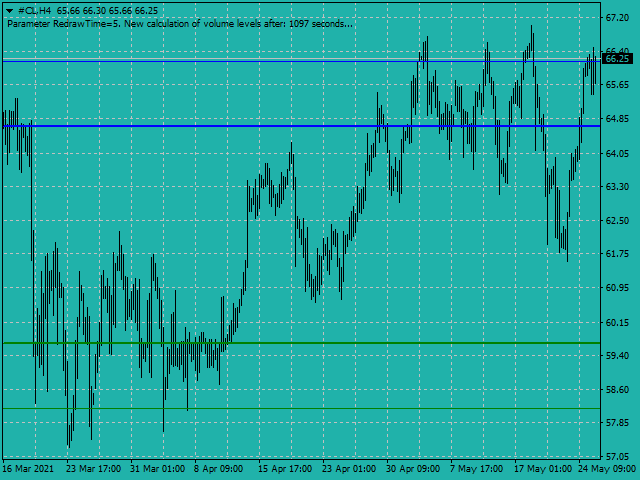
This indicator is able to determine the price levels at which there was the most volume over the specified period of history. In the future, the price often bounces off such levels, and this can be successfully applied in trading. They are displayed as lines, some parameters for determining the levels can be adjusted. This indicator is an improved version of Volume Levels, it notifies you when the price rebounds from the level, and can also notify you when the level is touched. In addition, this indicator has more settings for the best search for levels on all currency pairs and timeframes.
Parameters
- HistoryBars - the number of bars for determining the close volume levels;
- Range - the maximum distance for determining the levels (should be significantly greater than the minimum distance of opposite levels);
- MinDistOfOppositeLevels - the minimum distance of opposite levels (the larger it is, the farther the levels will be from each other, but it will be more difficult to find them (for small timeframes it is recommended from 20 to 100, for large ones - above 100);
- HistoryBarsLevels2 - the number of bars to determine the distant volume levels;
- MinDistanceLevels2 - minimum distance from the near level to the far one;
- RedrawTime - level redrawing time;
- LevelsDeterminationStep - the step for determining the levels (the smaller the step, the higher the accuracy, but the calculation of the levels may take longer);
- AutoAdjustParameters - automatic adjustment of some parameters for different currency pairs and timeframes;
- ClosedBarSignalOnly - receive a signal for alerts only when the bar is closed (otherwise, the signals will be before the close, and they may not be accurate);
- EnableReboundAlert - activate receiving alerts when the price rebounds from the level (when the price first passed the level, but then returned);
- EnableTouchAlert - activate receiving alerts when the price touches the level, or passed near it;
- TimeframeFindLevels - indicates the timeframe from which the levels will be read; to draw only the levels of the current timeframe, select the current timeframe;
- BarsForMinVolume - the number of last bars to determine the minimum volume for calculating levels (1-50);
- PeriodMA - the period of the Moving Average indicator to determine the center of the levels (1-100), the greater the PeriodMA, the slower the levels will react to changes in the current price);
- ColorLow - the color of the lower levels;
- ColorHigh - the color of the upper levels.
Also, there is a version of this indicator for MT5: