 Hey guys.
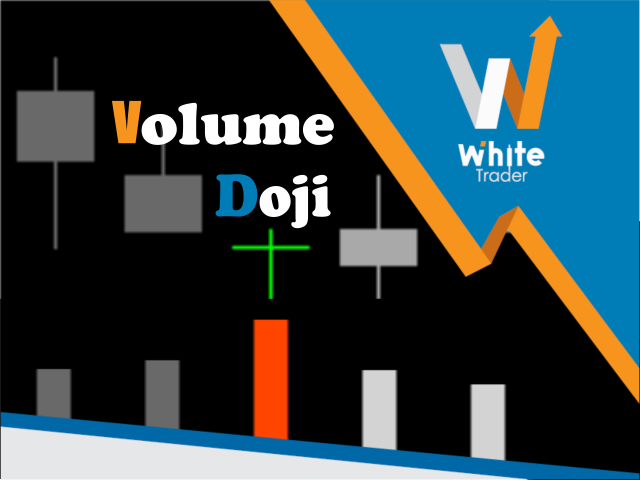
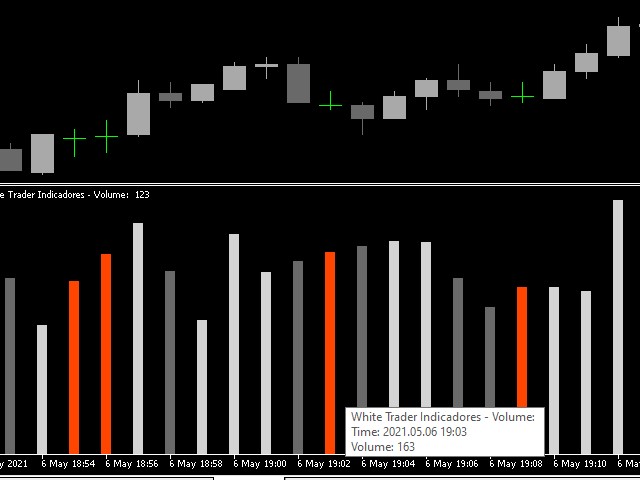
This indicator will show you, in the volume histogram, if the candle was a Doji, a bullish candle, or a bearish candle.
The construction of this indicator was requested by a trader who uses other indicators from my catalog, and I decided to release it free to help traders who think that the indicator can contribute to their operations.
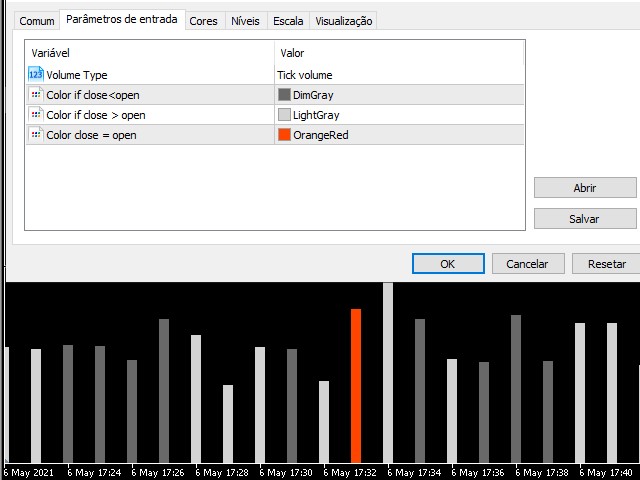
The parameters are:
- Volume Type: Real Volume or Tick Volume.
- Color if the candle is bearish: select the color.
- Color if the candle is high: select the color.
- Color if the candle is a Doji (Open = Close). Select the color.
Please leave a comment if the indicator helped you in any way!
Thanks.
Success and good trades!


