MT4-Candle Statistics and Swing Calculation
¥2,922.00
- Brand: LANCOME
- Product Code:
- Availability: In Stock
 Candle Data and Swing Data calculations
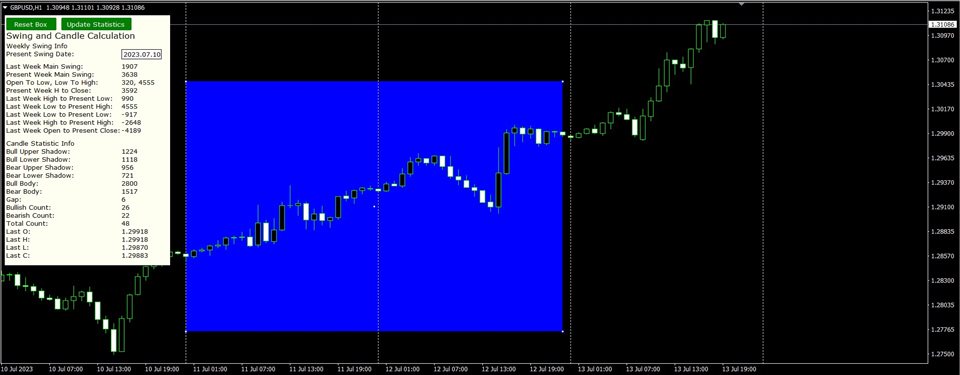
You have to use Rectangle Tool to select 1H Candle of last 2 days or 2 weeks
This Indicator will show:1. Summation of some Selective Candles Upper Shadow pips of Bull candle
2. Summation of some Selective Candles lower Shadow pips of Bull candle
3. Summation of some Selective Candles upper Shadow pips of Bear candle
4. Summation of some Selective Candles Lower Shadow pips of Bear candle
5. Summation of some Selective Candles Body pips of Bull candle
6. Summation of some Selective Candles Body pips of Bear candle
7. Summation of GAP pips ( last candle close price-present candle open price)
Bull and Bear Candle on those selected days
Totalmany candle selected
OHLC price
Using The Rectangle Tool to select 1H Candle of last 2 days or 2 weeks
All swings are below
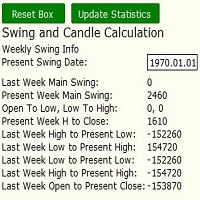
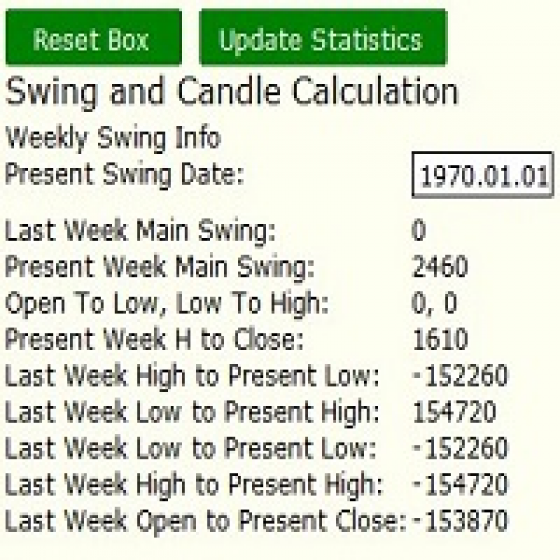
1.Last Day Main Swing (Top to Bottom or bottom to top pips)
2.Last Day High To Present Day Low (for 2days/ 2weeks)
3.Present Day Main Swing (Top to Bottom or bottom to top pips)
4.Open to H/L or L-H
5.Last Swing last day/Last Week (H-C)/(L-C)
6.Last Day Low To Present Day High
7.Last Day High (-) Present Day High
8.Last Day Low (-) Present Day Low
9.Last Day Open to Present Day Close
If need any help can contact me
azfxlive@gmail.com
Telegram@zabirfx


