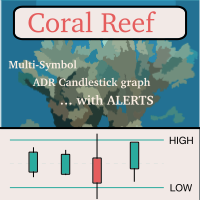
Coral Reef is a multi-symbol ADR candlestick graph. It allows you to monitor the movement of as many symbols as you like from a single chart as a percentage of ADR (Average Daily Range). You can select the timeframe to analyze, though I recommend monitoring the daily timeframe. You can receive alerts when price exceeds an ADR level. You can also display RSI values on the graph and get alerted when RSI exceeds the high or low values for a symbol. In effect it is like a multi-symbol ADR and RSI dashboard, but visually presented as candlesticks rather than as a table of values.
INPUTS
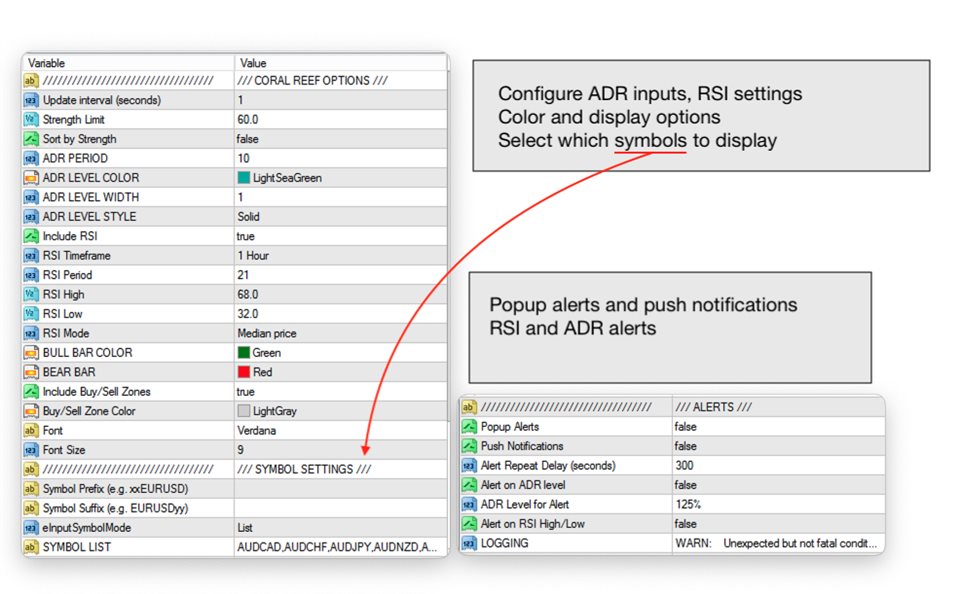
- Update interval (seconds) - How often the candlesticks are redrawn. The RSI value always comes from the previously closed candle on the RSI timeframe.
- Strength Limit - When currency strength data is available (see below), determines whether the symbol is displayed with BULL (long) or BEAR (short) colors.
- Sort by Strength - When currency strength data is available, determines whether the symbols are sorted left-to-right based on currency strength.
- ADR period, colors, styles - Options for ADR used to draw the ADR levels on the graph.
- Include RSI - When true the RSI values for each symbol are also displayed.
- RSI timeframe, period, high/low, price - RSI settings
- Bull/Bear colors - Colors used for candlesticks as well as RSI values and currency strength directions.
- Buy/Sell Zones - Possibly of interest when used with currency strength data; highlights the three strongest SELL and three strongest BUY currencies.
- Font, font size - For symbol names and RSI values
- Alerts - Popup alerts and push notifications for reaching ADR levels and/or RSI high/low values
ADR CANDLES
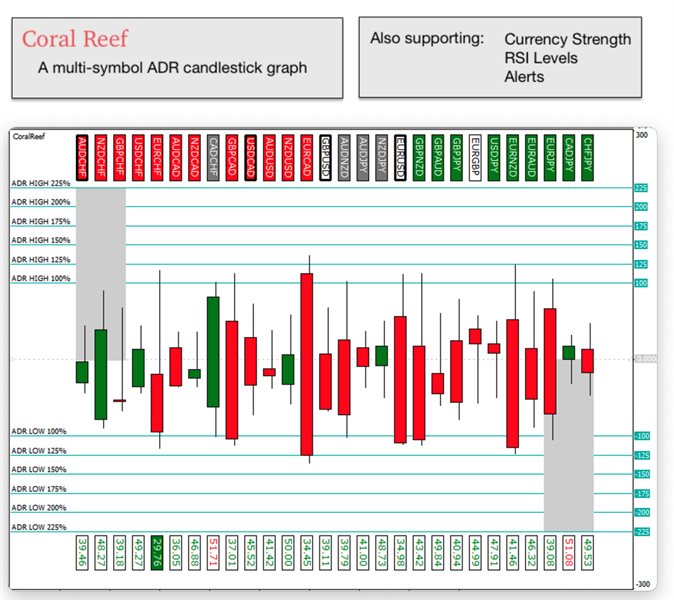
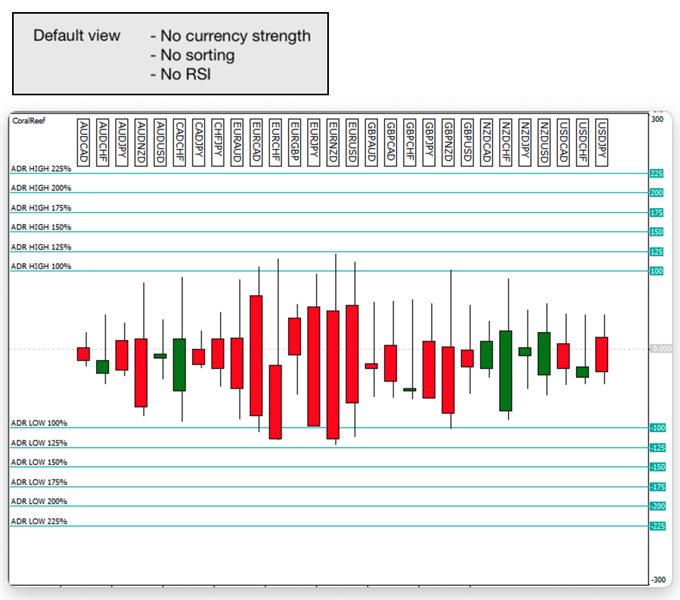
Each candle is showing the movement of each symbol as a percentage of ADR (Average Daily Range). The wicks of the candles show the High/Low of the day relative to ADR high/low. The bodies of the candles are showing how far each symbol has moved for the current timeframe, based on the chart timeframe that Coral Reef is running on. If you put Coral Reef on an H1 chart, then you will see how far each symbol has moved during the current H1 candle as a percentage of ADR. Typically you would put Coral Reef on a D1 chart, and then you can monitor the movement of each symbol during the day.
Coral Reef is displaying in a sub-window. I recommend dragging the chart divider up to maximize the amount of room available for Coral Reef to draw. It will attempt to fit all of its objects into the available chart dimensions, but it's possible for the objects to get very cramped when there is not much room available. Experiment with the window sizing until you have a satisfactory view. This is an unusual kind of indicator; it's ignoring all of the chart data that it's drawing on and creating its own graph, but this also means that it is not as flexible as a standard MT4 chart in terms of supporting a wide range of window sizes.
If you have any open trades, Coral Reef will make the border of that symbol's label thicker to make it visually stand out. Also, if you click the symbol name in the row along the top it will open a separate chart for that symbol. This uses the same External Chart logic as other Coral products: you can adjust the settings of this chart (change the timeframe, indicators, properties etc.) to have it look the way you want. And then as you click other symbols in the Coral Reef window they will update the existing external chart to that symbol, rather than opening a new window from scratch.
CURRENCY STRENGTH
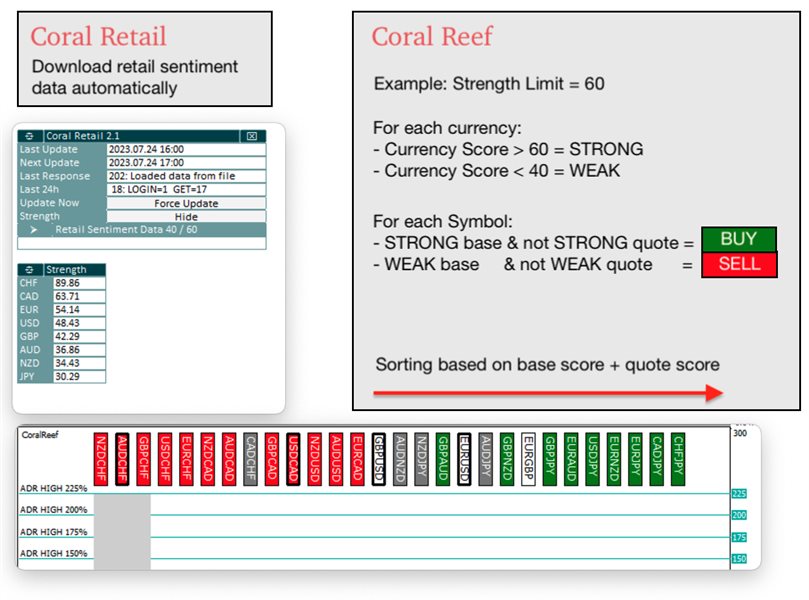
Coral Reef can optionally work with data downloaded from MyFxBook to sort the list of symbols by currency strength (based on client sentiment data) and to identify which symbols are stronger BUY or SELL candidates based on currency strength. Data is downloaded and analyzed by a separate tool, Coral Retail , available in the MQL5 Market ( here ). Coral Retail must be running for Coral Reef to use retail strength data.
The Strength Limit input option in Coral Reef works the same way as the Signal Level option in Coral Retail . A value above 50 means you're trading against retail sentiment; and a value below 50 means you're trading with retail sentiment. In the case of Coral Reef it means that if the Strength Limit is set to 60, then when a symbol has 60% or more of retail traders SHORT, Coral Reef will display it in BULL colors indicating market conditions for a BUY.
The two grey rectangles are available when currency strength data is available and the list of symbols is sorted. The symbols are sorted left to right, from strongest SELL to strongest BUY. The grey rectangle on the far left side and upper half of the chart is the SELL zone. When any of the three strongest SELL currencies (i.e., the currencies that are the most LONG by retail traders right now) are closer to the ADR high, then they are stronger candidates for SELL entries. The grey rectangle on the far right side and the lower half of the chart is the BUY zone. When any of the three strongest BUY currencies (most shorted by retail traders) are closer to the ADR low, then they are stronger candidates for BUY entries. The buy/sell zones simply highlight these areas of interest on the chart.

