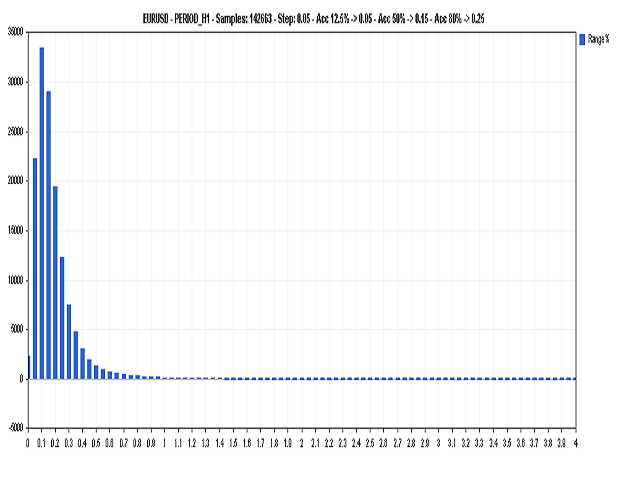
Plot an gauss distribution with the percentage range (high/low-1 from an bar). All history is used to built the graph.
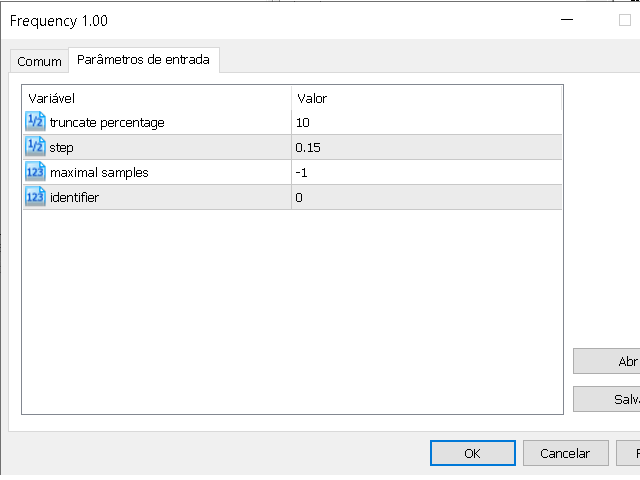
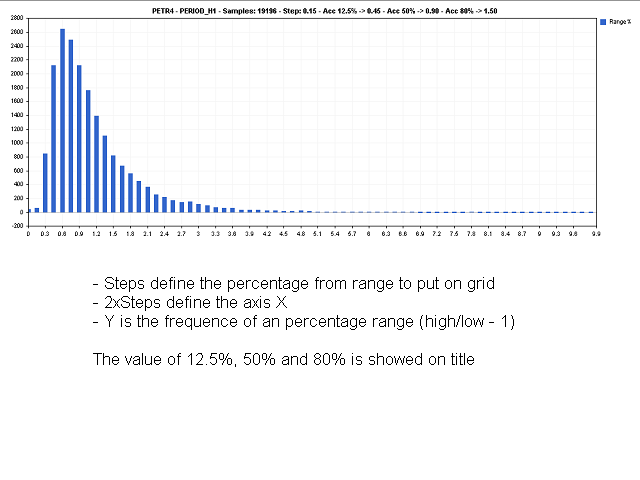
The user can limit the samples (how many bars to analyse if a positive value is given), limit the maximal percentage (truncate percentage) on visualization and an step to evaluate approximate values to one.
An 12.5%, 50% and 80% accumulation is showed on title to be easier discover what percentage is the most common.