 Gann Angles is one of finest concept to calculate Market Reversal Points. .Our tool calculates TIME & PRICE ANGLES which is gives you right direction of Up/Down Trend as well as reversal points.
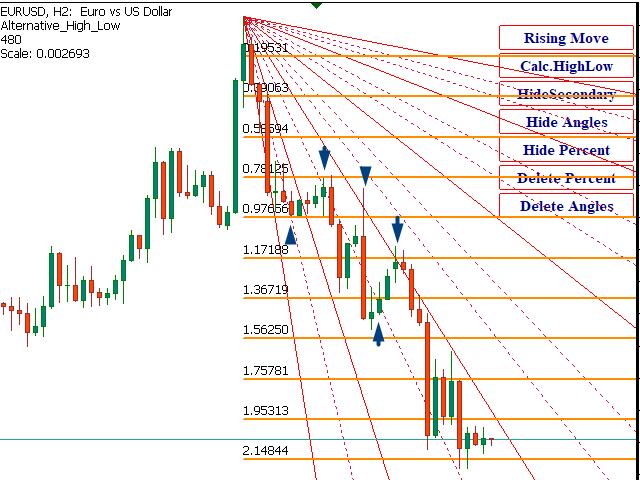
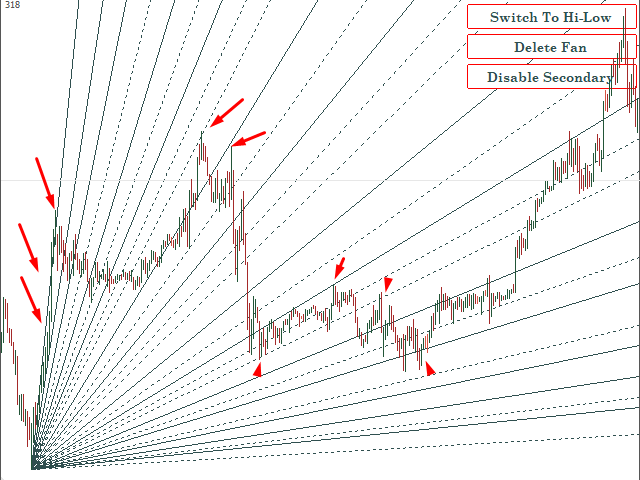
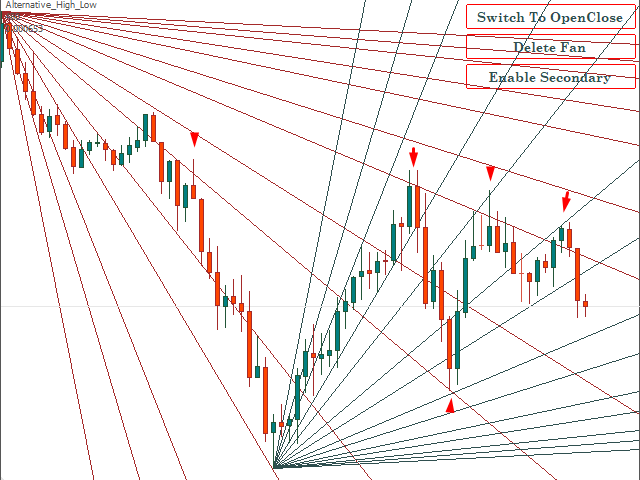
A UNIQUE COMBINATION OF BOTH PRICE & TIME VECTOR RATIOS TO DRAW 1X1,1X2,1X3,1X4,1X6,1X8,2X1,3X1,4X1,8X1 WHICH IS ACCURATE TIME/PRICE ANGLES.
About Gann angles :-
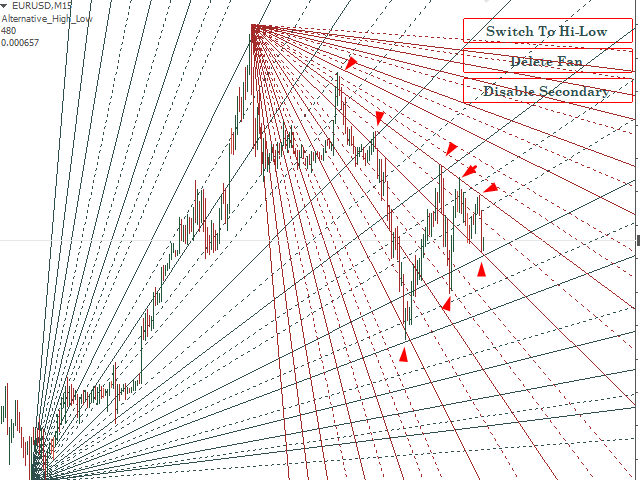
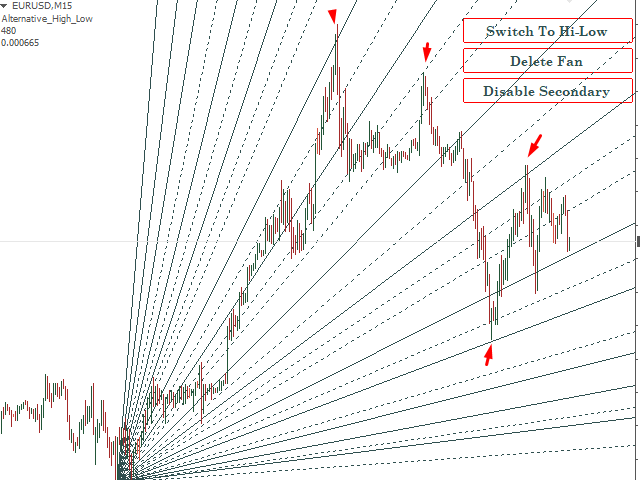
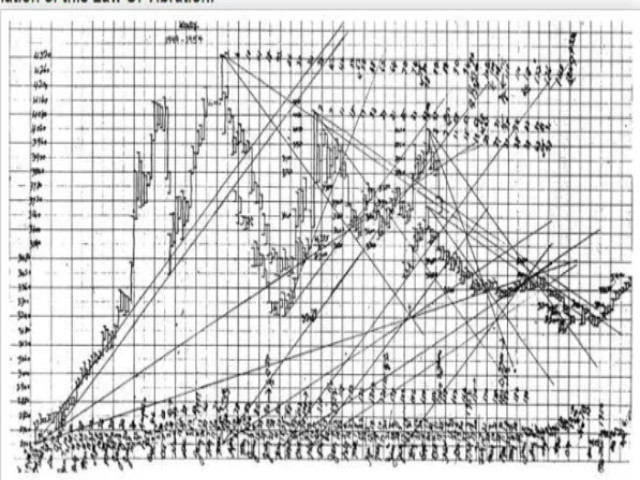
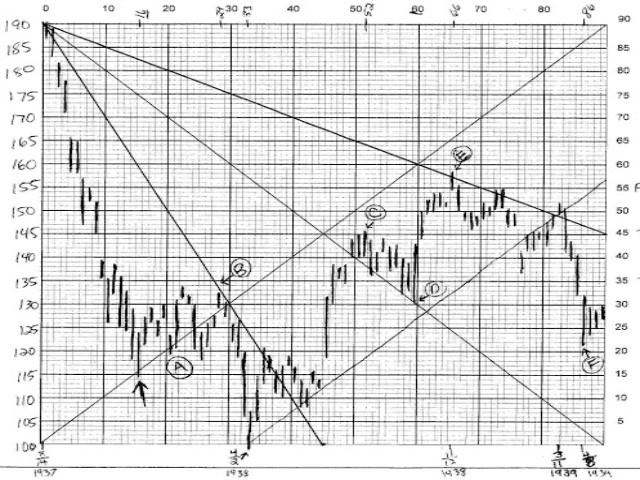
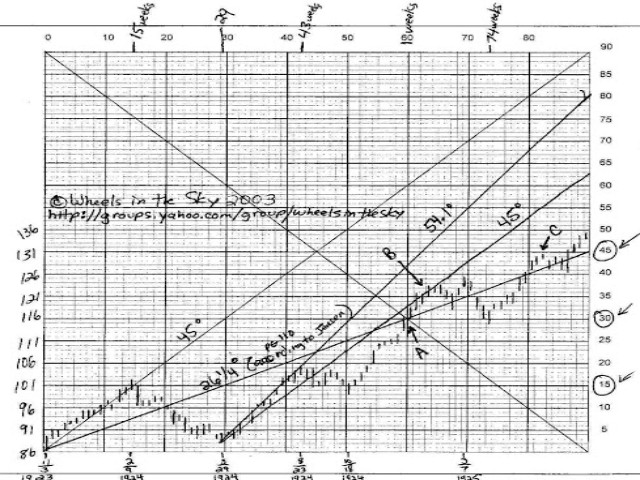
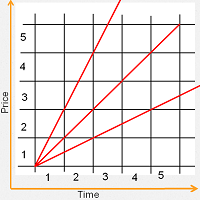
A Gann angle is a straight line on a price chart, giving a fixed relation between time and price. For Gann the most important angle was the line which represented one unit of price for one unit of time, called the 1x1 or the 45° angle. The value of a commodity or stock following this angle will for example increase by one point per day. Other important angles were the 2x1 (moving up two points per day), the 3x1, the 4x1, the 8x1, and the 16x1. In addition to these value increases, the corresponding angles for value decrease are just as important. When several of these angles are drawn in a group, they are often called a Gann fan , which is usually drawn from a price bottom or a price top.
As with other forms of Technical analysis of stock price movements, the Gann angle model contradicts the weakest form of the efficient-market hypothesis which states that past price movements cannot be used to forecast future price movements.
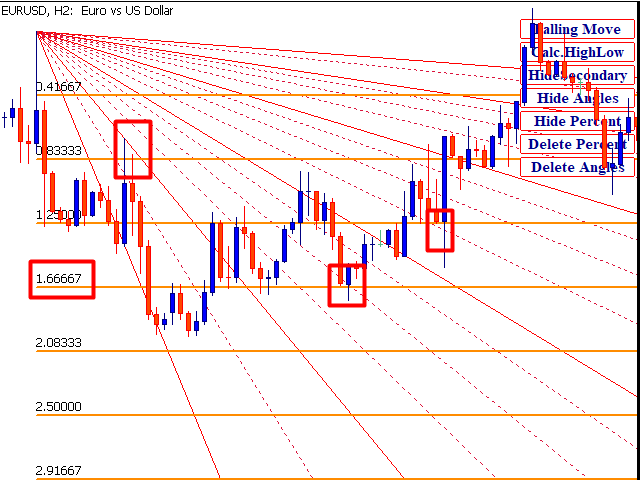
Gann watched for important tops and bottoms to form on a daily, weekly, or monthly chart and drew his angles from these changes in trend. When the trend is up and the price stays in the space above an ascending angle without breaking below it, the market is strong; when the trend is down and the price remains below a descending angle without breaking above it, the market is weak. The market shows its relative strength or weakness according to the angle it is above or below. For example, if the price is above the 2x1 the market has shown itself to be much more bullish than if it is above the 1x1. In his angles course, Gann argues that when an up trending price reverses and breaks under an ascending angle, the tendency of the price is to go to the next nearest angle below it; likewise, when a down trending price reverses and breaks up through a descending angle, the tendency of the price is to go to the next nearest angle above it.
WORKS FOR INTRA DAY 15 MIN,30MIN, H1,H4 & DAILY WEEKLY MONTHLY.
Contact us for free training session via Skype /Anydesk Remote
SEE VIDEOS HOW TO USE GANN ANGLE :-
Turning forecast by gann angles :- https://youtu.be/CVJgkXS3zms
PARAMETERS
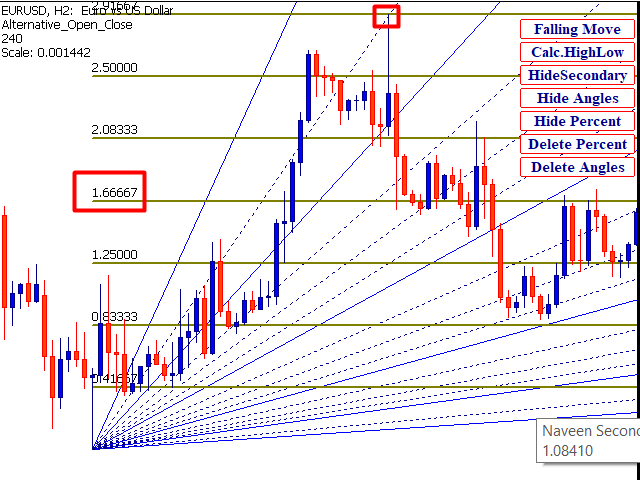
Method=Alternative_Open_Close;High low ( calculation method)
Fixed Scale=0.0001;( if you want to use your own scale of angles )
Bars_To_Process=480;
Angles Quantity=7,
Secondary Angles=true;
Draw Back ground=true;
Main Angles Line Style=Solid,
Secondary Angles Line Style=Dot;
Main Angles Line Width=2;
Secondary Angles Line Width=1;
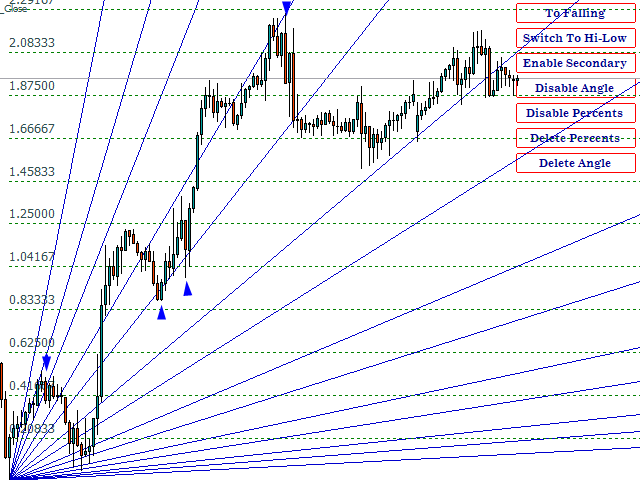
Rising Main Angles Clr=Blue,
Rising Secondary Angles Clr= Medium Blue,
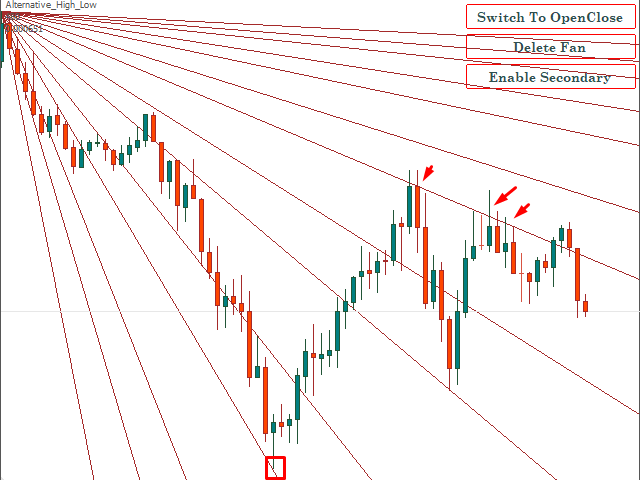
Falling Main Angles Clr=Orange Red,
Falling Secondary Angles Clr=Red;
Buttons Height=25;
Buttons Width=170;
Buttons Color=White; Buttons Borders Color=Red;
Font="Century Schoolbook Bold"; Text Color=Dark Blue; Text Size=11;