This is a multi-symbol and multi-time frame, fully customizable alert based on a stochastic oscillator (SO) and moving average (used for trend confirmation) calculations. This tool returns most recent buy/sell signal from user-defined time periods on the fly! Alert action can be performed for a specified trade type: "buy", "sell" or "buy or sell" on your wish. Unlike of many alerts, this is a "map" of conditions which gives you full information of indicator positions without opening and searching many charts. This program is a table with cells painted on colors related to trade conditions. If any row have one color, important buy/sell conditions were met.
Key features:
- most recent trade signals from user-defined 10 time frames / symbol in real-time
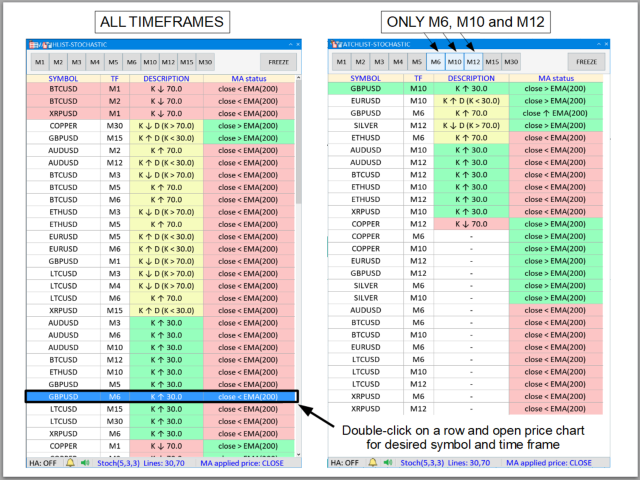
- double click on chosen table row and open price chart for desired symbol and time frame instantly!
- fully customizable indicators (including Heikin Ashi calculations) and alert parameters
Meaning of cell colors in the table (can be redefined by user):
- GREEN - buy signal,
- PINK - sell signal,
- YELLOW - pay attention for incoming potential buy/sell conditions (for example K line cross up 80, so expect that price probably abandom overbought area soon)
- ORANGE and "PENDING" description - waiting for data from broker.
Main GUI:
- User-defined time frame buttons: This is a filter for time frames for alert messages. If neither of them is selected, condition for buy/sell oportunity for all defined time frames will be considered
- FREEZE button: freeze current table view. It is useful when many signals appears and changing at the same time.
Table and meaning of description in cells (table):
"Description" column ("line1" and "line2" are related to oversold and overbought area, respectively):
- K ↓ line1 - "K" line cross down "line1"
- K ↑ line1 - "K" line cross up "line1"
- K ↑ line2 - "K" line cross up "line2"
- K ↓ line2 - "K" line cross down "line2"
- K ↓ D (K > line2) - "K" line cross down "D" line (overbought area)
- K ↑ D (K < line1) - "K" line cross up "D" line (oversold area)
"MA (Moving Average) status" column:
- price ↑ MA - price cross up last "MA" point
- price ↓ MA - price cross down last "MA" point
- price > MA - last two price points above "MA"
- price < MA - last two price points below "MA"
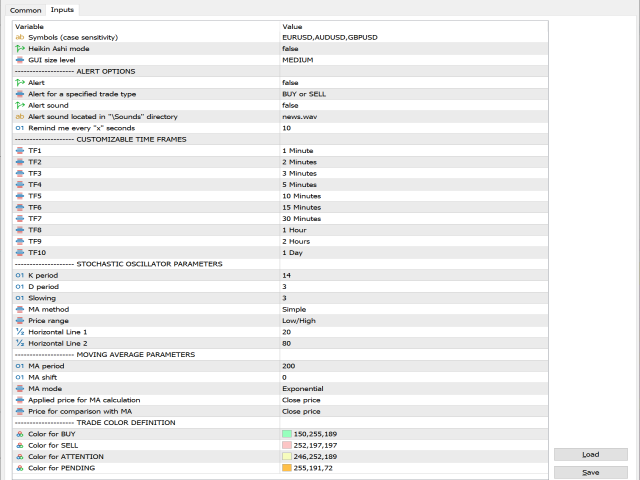
Main parameters (see picture):
- Symbols - Comma-separated list of symbols you wish to analyze. Input values are case sensitivity.
- Heikin Ashi mode - If true, all indicators will be calculated from Heikin Ashi candles except Price for comparison with MA (see MOVING AVERAGE parameters section)
- GUI size level - Change size of graphical user interface. Select: SMALL, MEDIUM or LARGE.
CUSTOMIZABLE TIME FRAMES options:
STOCHASTIC OSCILLATOR parameters:
- TF1 ... TF10 - Choose set of time frames among 10 slots
- K period - N-period of price range used for K-line calculations
- D period - N-period smoothed average of K line
- Slowing - Additional smooth for K and D line
- MA method - Corresponds to a moving average method for D-line calculations (Simple, Exponential, Smoothed, Linear Weighted)
- Price range - Considered lowest and highest price within N-period. Choose between: low-high or close-close.
- Horizontal line 1 and 2 - Lines corresponds to oversold (below Line 1) and overbought (above Line 2) area.
MOVING AVERAGE parameters:
- MA period - Moving average period
- MA shift - How many bars moving average is shifted
- MA mode - Calculation method (Simple, Exponential, Smoothed, Linear Weighted)
- Applied price - Price input for moving average calculations: (open,close,low,high,median,typical,weighted)
- Price for comparison with MA - Type of last two prices for comparing with moving average indicat