Please leave 5 Stars to me
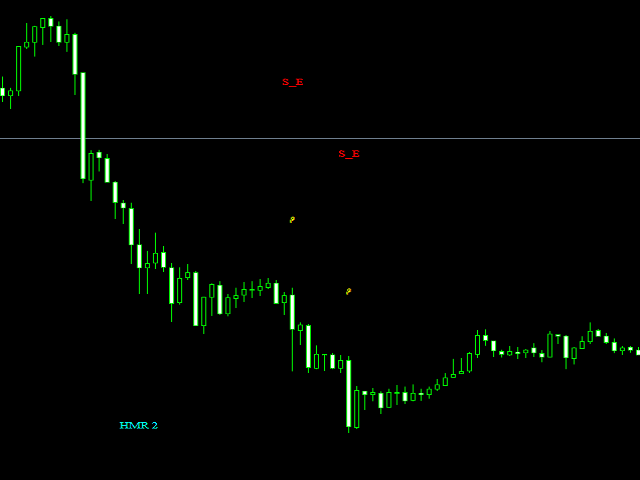
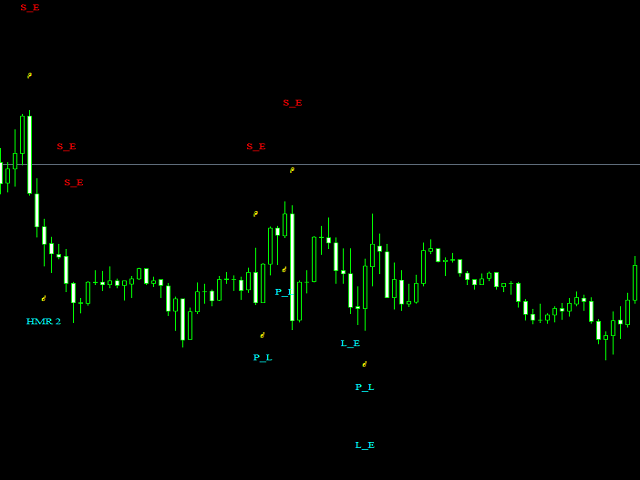
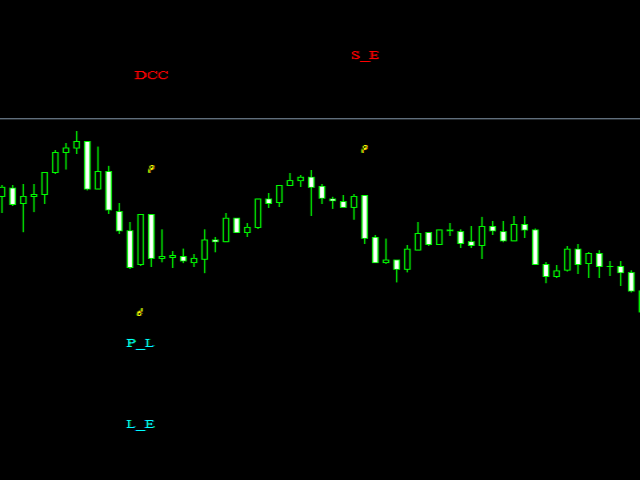
Candlestick Patterns Scanner is professional indicator that will assist and alert you to identify candlestick patterns on meta trader 4 charts whenever a pattern appears on the chart.
In financial technical analysis , a candlestick pattern is a movement in prices shown graphically on a candlestick chart that some believe can predict a particular market movement. The recognition of the pattern is subjective and programs that are used for charting have to rely on predefined rules to match the pattern/
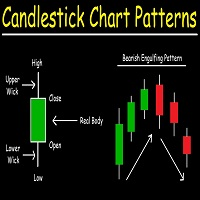
Candlesticks are graphical representations of price movements for a given period of time. They are commonly formed by the opening, high, low, and closing prices of a financial instrument.
If the opening price is above the closing price then a filled (normally red or black) candlestick is drawn.
If the closing price is above the opening price, then normally a green or hollow candlestick (white with black outline) is shown.
The filled or hollow portion of the candle is known as the body or real body , and can be long, normal, or short depending on its proportion to the lines above or below it.
The lines above and below, known as shadows , tails , or wicks , represent the high and low price ranges within a specified time period. However, not all candlesticks have shadows.
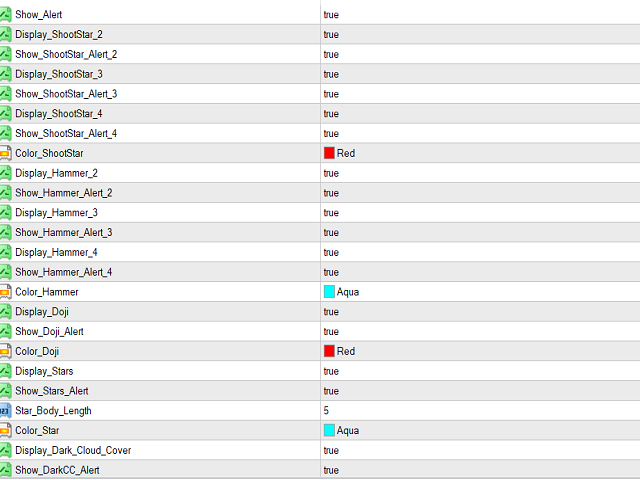
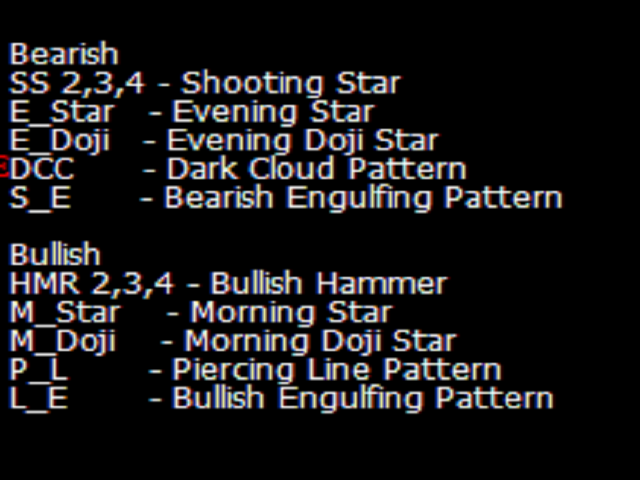
Candlestick Patterns Scanner contains many patterns some of the patterns that include are as follows.
BEARISH
- SHOOTING STAR
- EVINING STAR
- DARK CLOUD PATTER
- BEARISH ENGULFING PATTERN
- DOJI
BULLISH
- BULLISH HAMMER
- MORNING STAR
- MORNING STAR
- PERICING LINE PATTERN
- BULLISH ENGLUFING PATTER
- DOJI
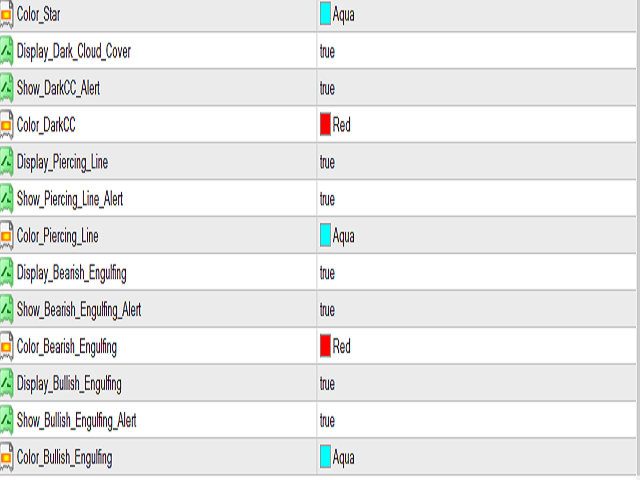
you can turn and turn off any pattern you like from the input menu.
indicator works on all time frames.