|
The functionalities included are:
-
Displays the calculated multi-timeframe Fibonacci levels in a dimension for visual clarity.
-
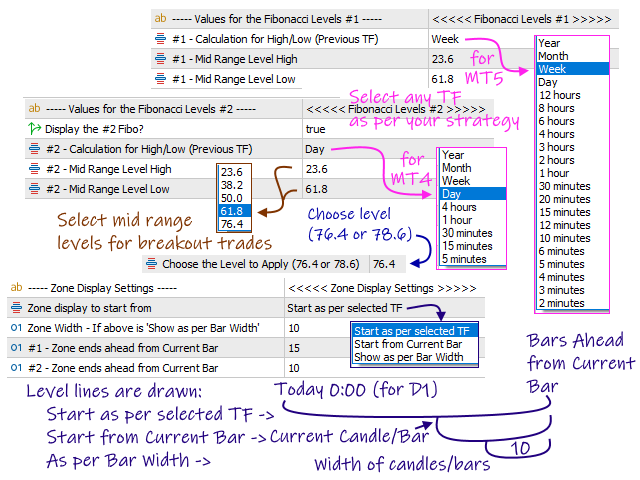
Includes the previous ‘Year’ for selection as a timeframe for calculation.
-
Incorporates the additional Sunday candle to the previous Friday and calculates the levels for Monday (Day - D1).
-
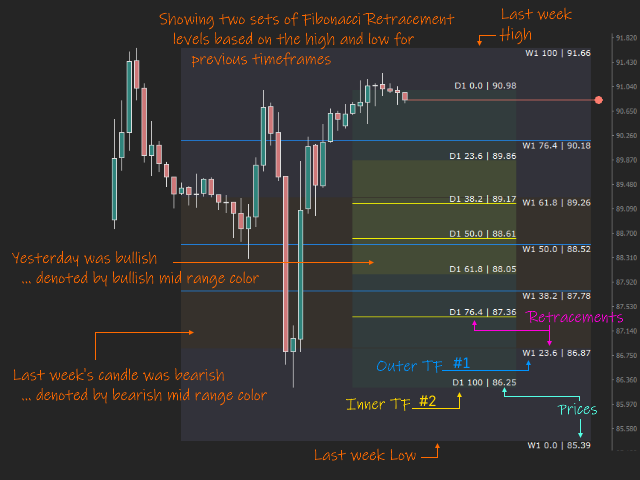
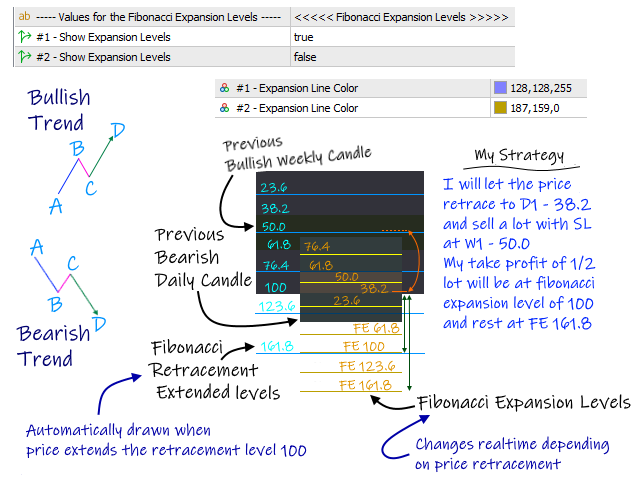
Able to define a Fibonacci retracement level as the mid-range to be displayed in a different color. The display of mid-range color considers the previous timeframe candle (bullish or bearish).
-
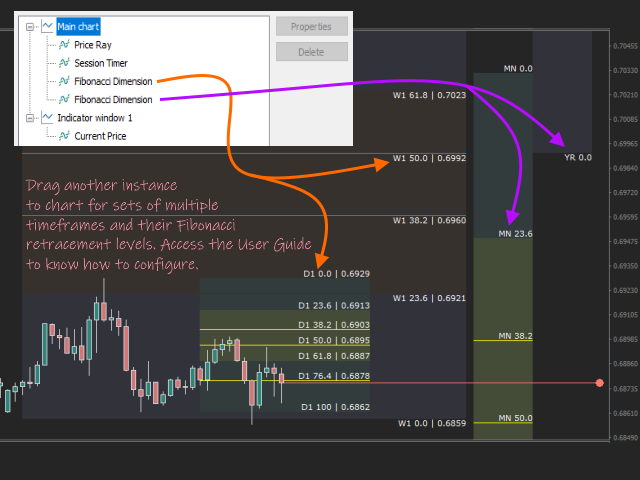
Supports multiple instances of the indicator on the chart to display more sets of timeframe retracements.
-
Allows to toggle the display of extended line till the start of timeframe period by a mouse click on the level or text.
-
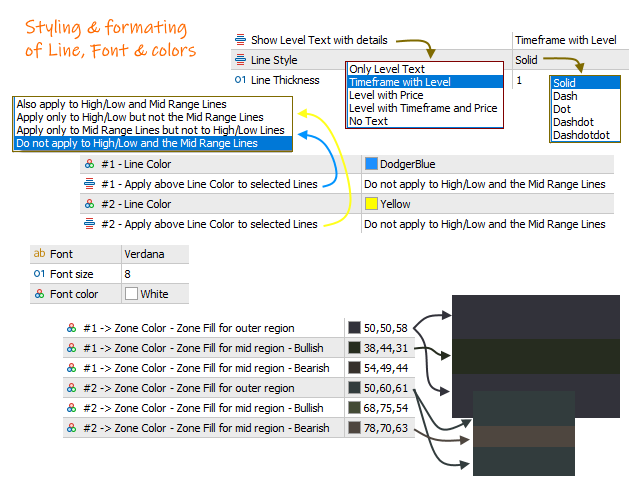
Customizable formatting of line, font and colors used by the indicator.
-
Option to show timeframe, level text, along with price for each level.
Also, includes Fibonacci Expansion levels to allow you to strategise your exit of trades. The indicator draws the extended retracement levels in case the price breaks the 100 level.
|
|
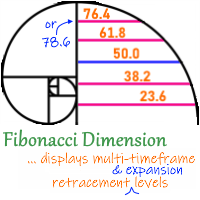 'Fibonacci Dimension' indicator allows visual display of Fibonacci retracement and expansion levels. It automatically takes the previous high and low for two user-defined timeframes and calculates their Fibonacci retracement levels. It also considers the retraced level to draw the expansions on every change of price. The complete visual dimension in multiple timeframes allows deriving profitable strategies for execution.