 Great smart dashboard for market analytics.
Using this dashboard you can:
- find signals from different indicators from all timeframes ;
- find signals from the Moving Average from all symbols ;
Include:
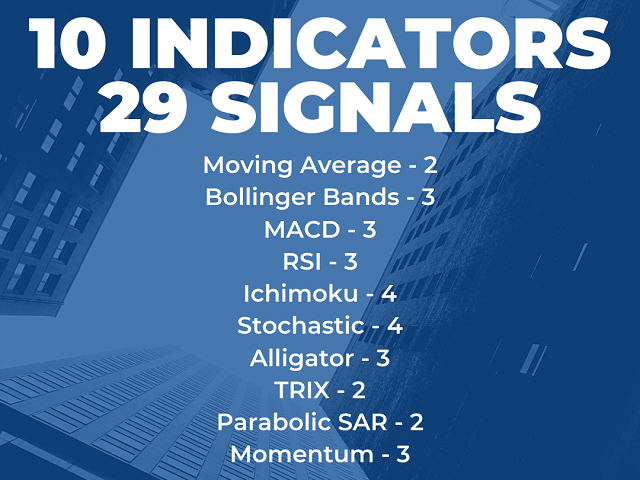
- 9 indicators (10 in Mt5 version);
- 27 signals (29 in Mt5 version);
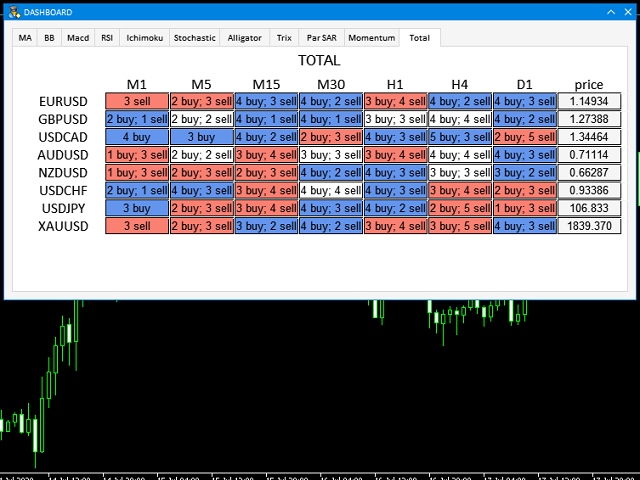
- "Total" page.
Indicators and signals:
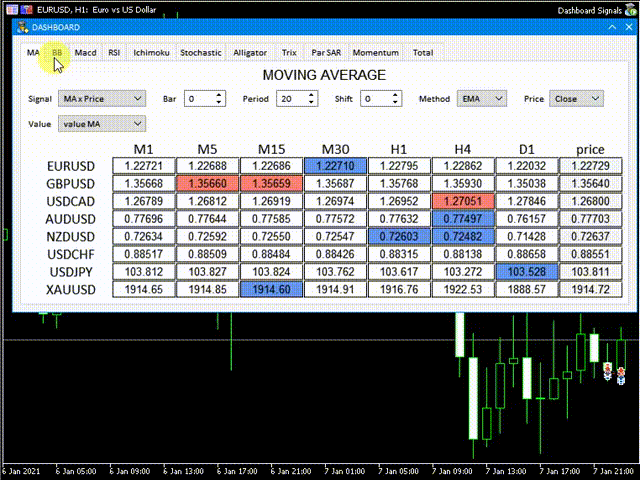
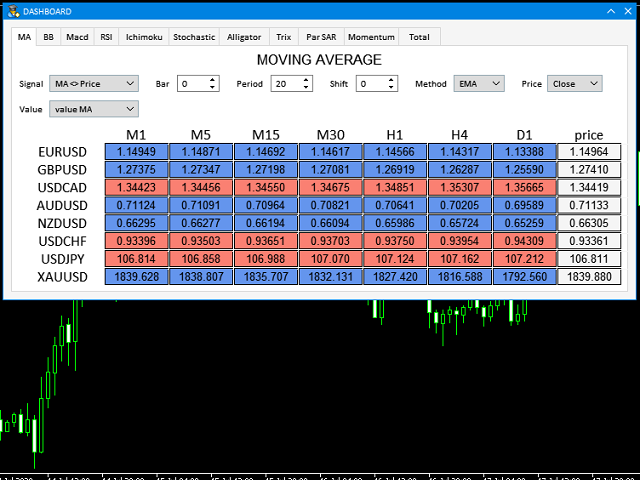
- MOVING AVERAGE
- MA cross Price - MA crosses Price;
- MA more/less Price - MA higher/lower Price;
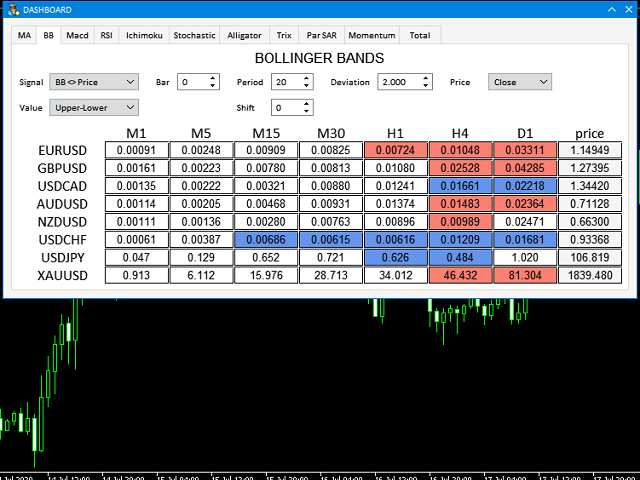
- BOLLINGER BANDS
- BB crosses Price (in) - Price crosses Bollinger (upper/lower line) inside;
- BB crosses Price (out) - Price crosses Bollinger (upper/lower line) outside ;
- BB more/less Price - price < BB(low) or price > BB(upper)
- Moving Averages Convergence/Divergence (MACD)
- MACD x '0' (main) - MACD crosses zero line (by histogram line);
- MACD x '0' (sign) - MACD crosses zero line (by signal line) ;
- MACD Main x Sign - main line (histogram) crosses signal line;
- Relative Strength index (RSI)
- RSI x Level (in) - RSI crosses level sell out/buy out inside;
- RSI x Level (out) - RSI crosses level sell out/buy out outside ;
- RSI <> Level - RSI < level sell out or RSI > level buy out;
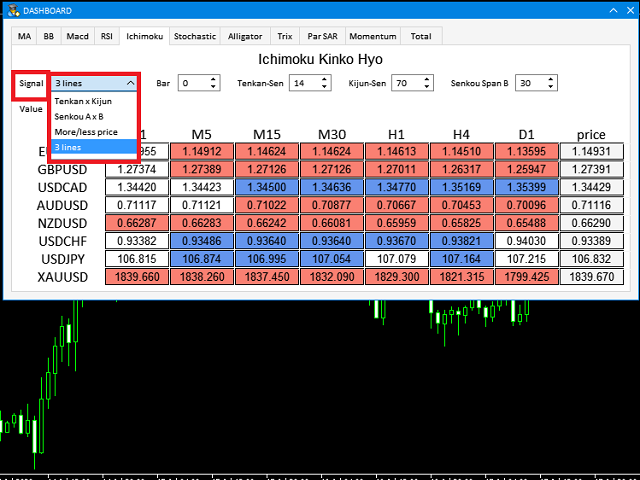
- Ichimoku Kinko Hyo
- Tenkan x Kijun - Tenkan crosses Kijun (The Golden Cross / The Dead Cross);
- Senkou A x B - Senkou A crosses Senkou B ;
- more/less Price - Price higher/lower than cloud - KUMO;
- 3 lines - price < Tenkan, Tenkan < Kijun, Kijun < Kumo or price > Tenkan, Tenkan > Kijun, Kijun > Kumo;
- Stochastic Oscillator
- Stoch x Level (in) - Stochastic crosses level sell out/buy out inside ;
- Stoch x Level (out) - Stochastic crosses level sell out/buy out outside ;
- Stoch Main x Sign - main line crosses signal line;
- Stoch <> Level - main line Stoch < level sell out or main line Stoch > level buy out;
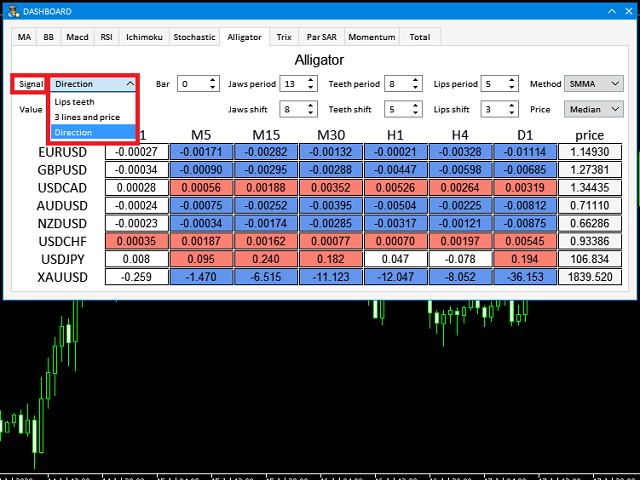
- Alligator
- Lips teeth - Lips line crosses Teeth line;
- 3 lines and price - JAW > TEETH > LIPS and price crosses LIPS from bottom to top OR JAW < TEETH < LIPS and price crosses LIPS from top to bottom;
- Direction - JAW > TEETH > LIPS or JAW < TEETH < LIPS ;
- Parabolic Stop and Reverse system (Parabolic SAR)
- ParSAR x Price - indicator crosses Price;
- ParSAR <> Price - indicator higher/lower than price;
- Momentum
- Momentum cross 100 - indicator crosses "100" line;
- Momentum and 100 - indicator higher/lower than "100" line;
- Momentum dir - indicator direction (growths or falls).
Work option:
- all symbols attached to Market Watch
- current symbol only
- symbols from the list
Colour:
- if the background of the cell is “blue”, then this is a buy signal
- if the background of the cell is "red", then this is a sell signal
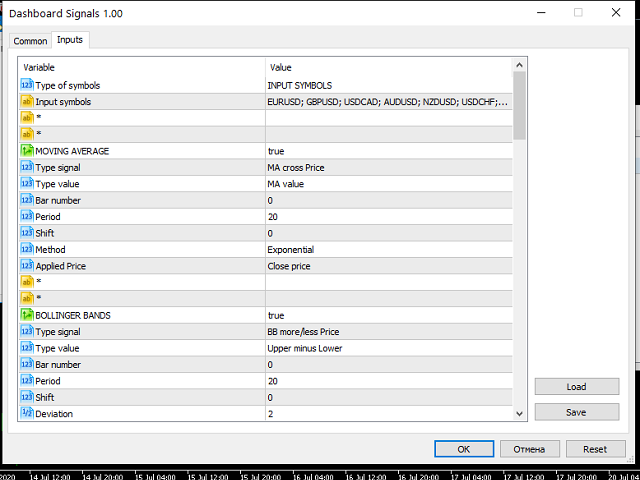
Parameters:
- Type of symbols - selection of a working option: ALL SYMBOLS MARKET WATCH - all symbols from "Market Watch"; ONLY CURRENT SYMBOL - only the current symbol; INPUT SYMBOLS - symbols from the list;
- Input symbols - a list of symbols to work with (if "type_symbols" is INPUT SYMBOLS);
- Indicator parameters
Dashboards (Meta Trader 4):
- BIG DASHBOARD (all in one)
- Moving Average
- Bollinger Bands
- Envelopes
- MACD
- RSI
- Ichimoku
- Stochastic
- Alligator
- Parabolic SAR
- Momentum
Dashboards (Meta Trader 5):
Before buy - look the video
After use - please write your comment, this will help us make the product better.