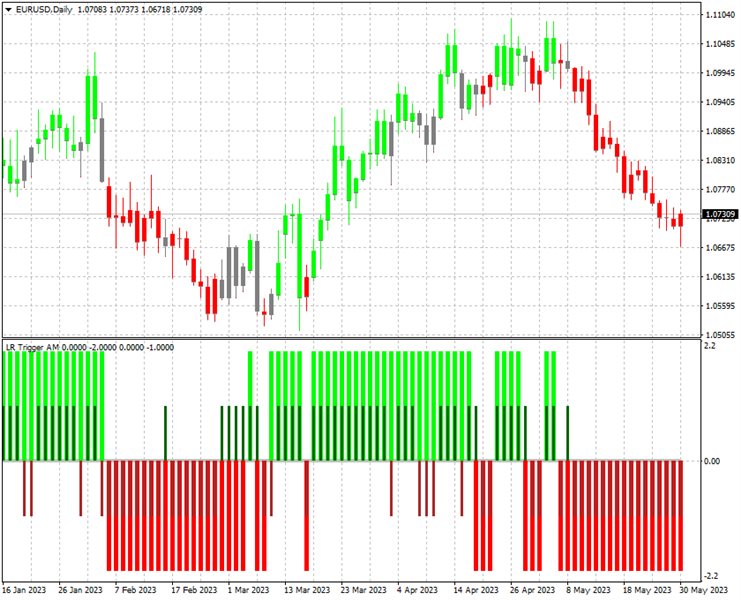
This indicator displays linear regression data of financial instrument prices for two different periods.
The user has the ability to select the prices at which the calculation is made.
The position of the histogram above zero indicates an increase in prices.
The location of the histogram below zero indicates a fall in prices.
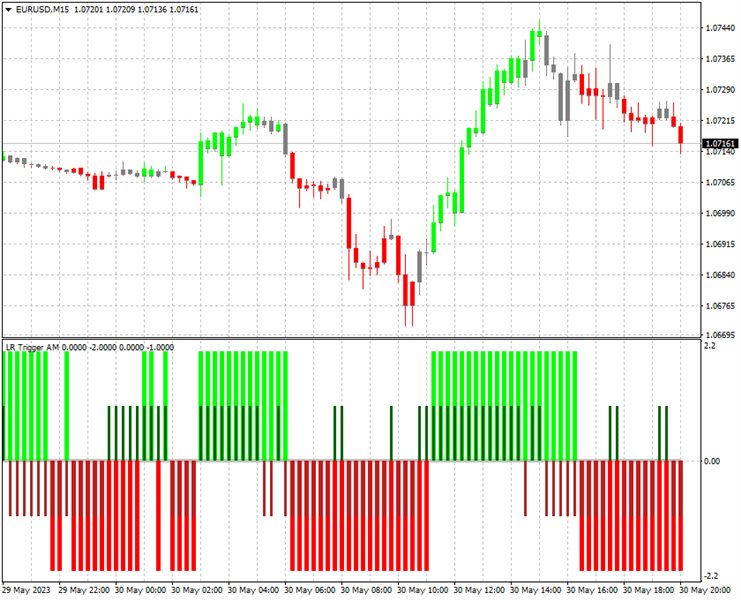
On fully formed chart bars, the indicator is not redrawn.
At the same time, the indicator values at 0 bar (the current bar, the bar that has not finished forming yet) may change.
Thus, the indicator values at 0 bar should be ignored.
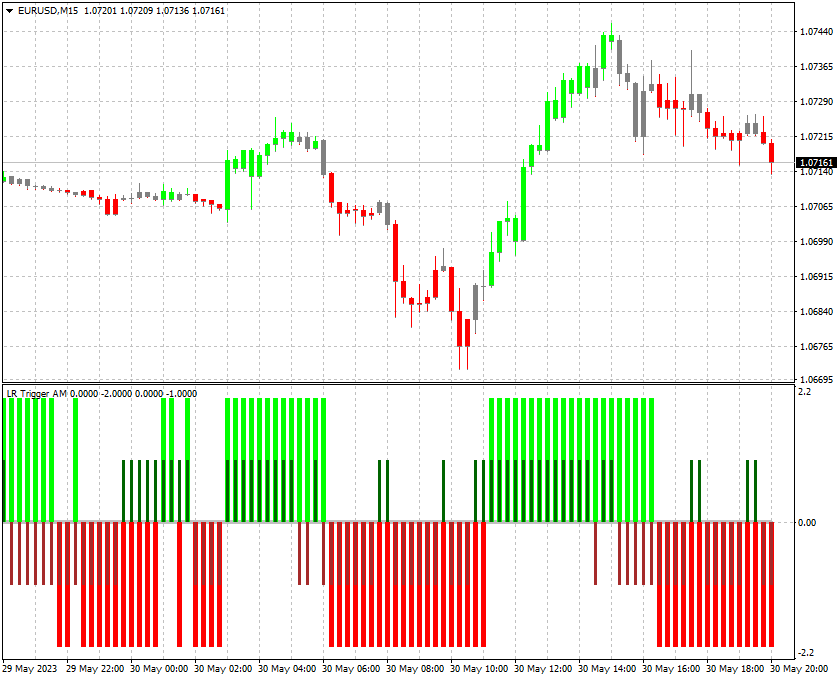
- Sale subject to all conditions:
- Purchase subject to all conditions:
- Indicator data at 0 bar is ignored;
- On bar 1, both histograms of the indicator are below zero;
- On bar 2, one or both indicator histograms are above zero.
- The price has overcome at least 1 bar.
- Indicator data at 0 bar is ignored;
- On bar 1, both histograms of the indicator are above zero;
- On bar 2, one or both indicator histograms are below zero.
- The price has overcome the maximum of 1 bar.
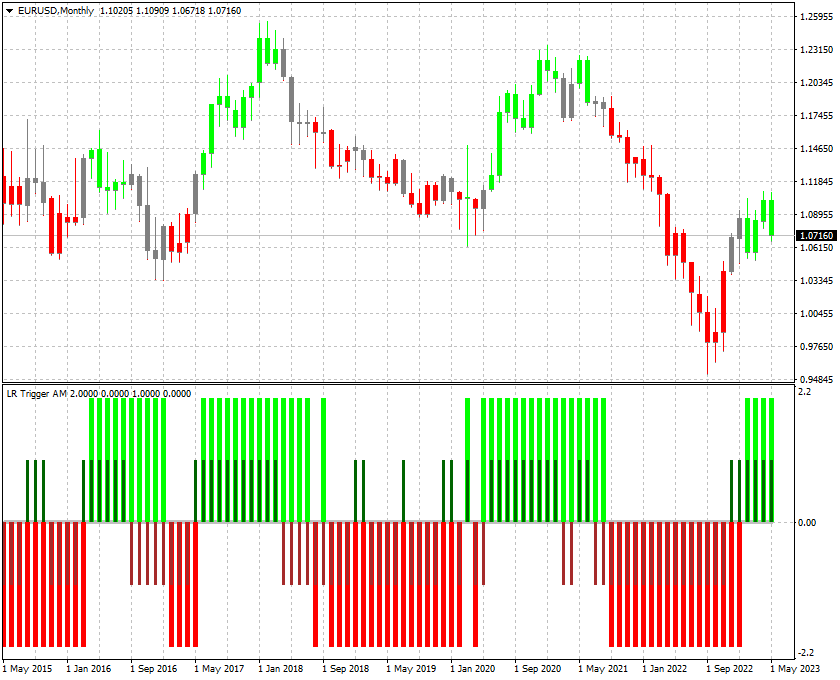
The indicator has configurable parameters:
- LR_1_Period - The first period for which the prices are taken to calculate the linear regression;
- LR_1_Price - Prices that are taken to calculate the linear regression for the first period;
- LR_2_Period - The second period for which the prices are taken to calculate the linear regression;
- LR_2_Price - Prices that are taken to calculate the linear regression for the second period.