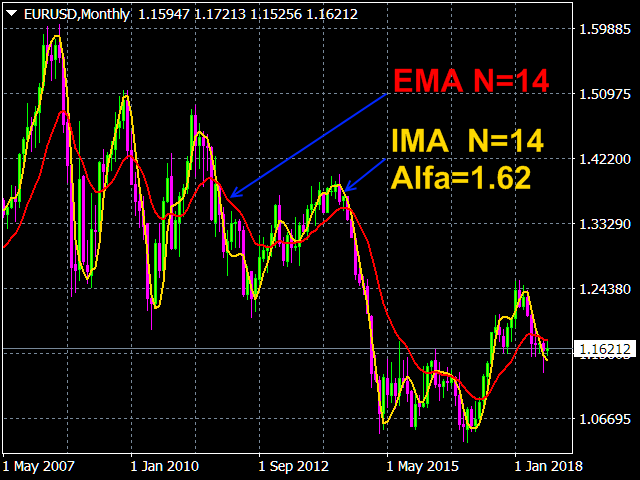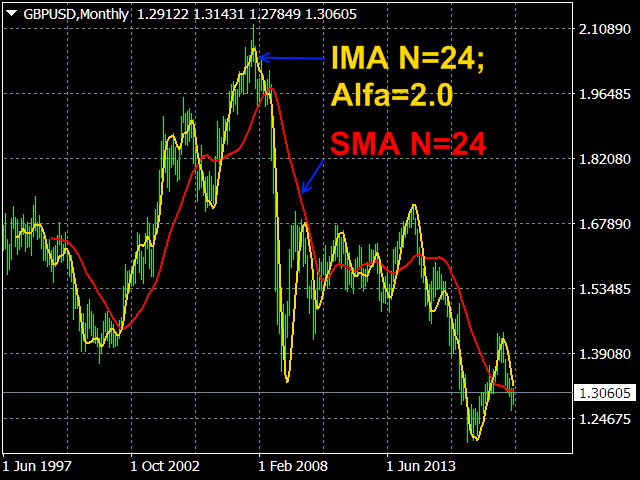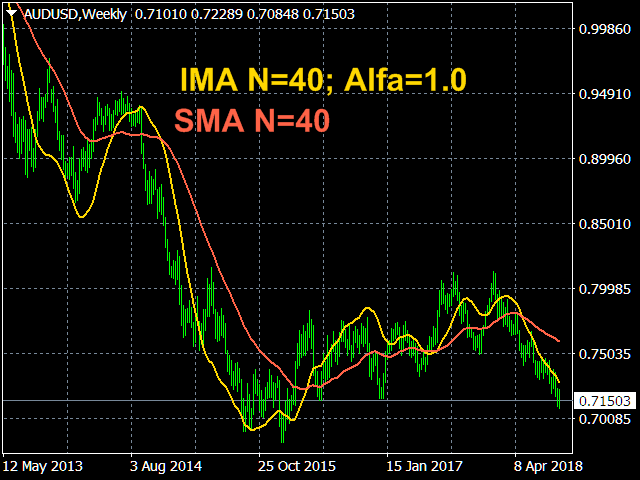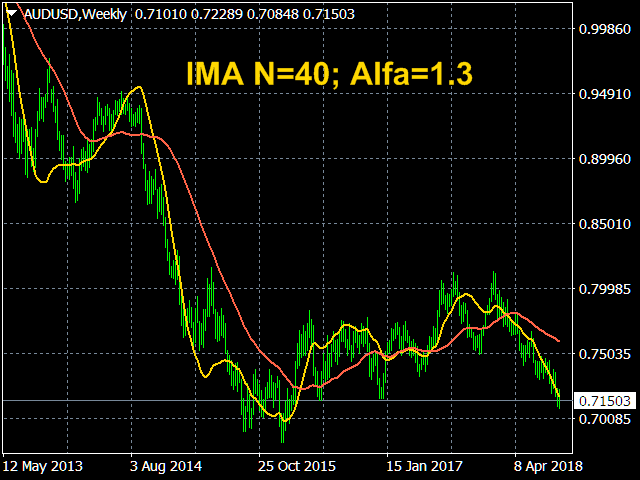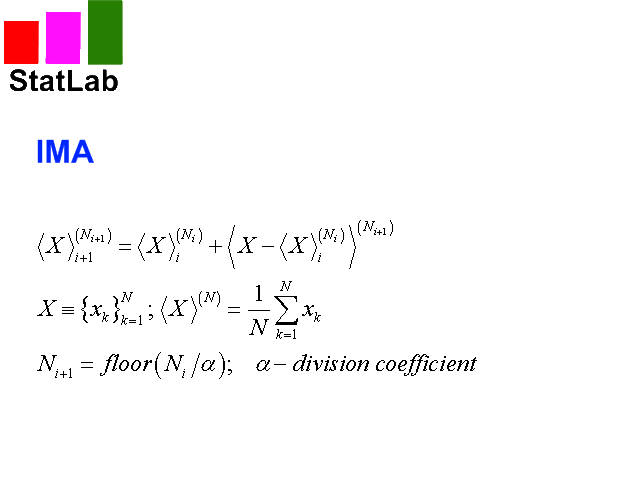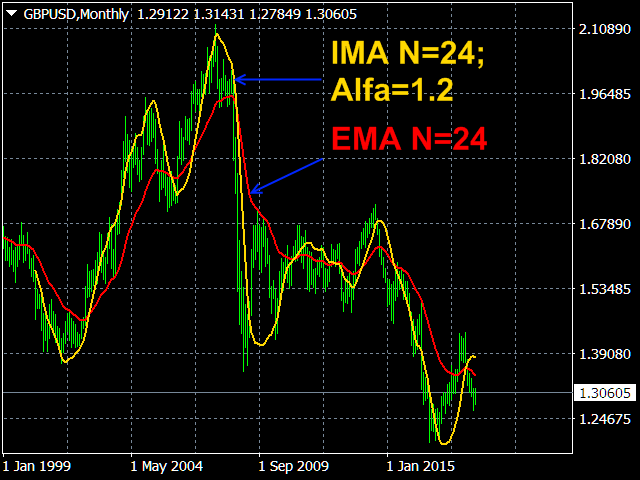
Iterative Moving Average – IMA. IMA is obtained by correcting the usual MA. The correction consists in addition to MA averaged difference between the time series (X) and its MA, i.e. IMA(X)=MA(X) + MA ( Х -MA(X)). Correction is done in several iterations (and, exactly, 2 iterations in this indicator) and with a change in the averaging period.
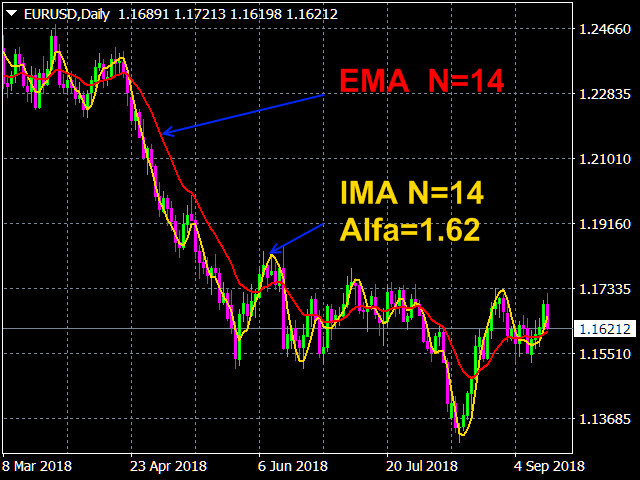
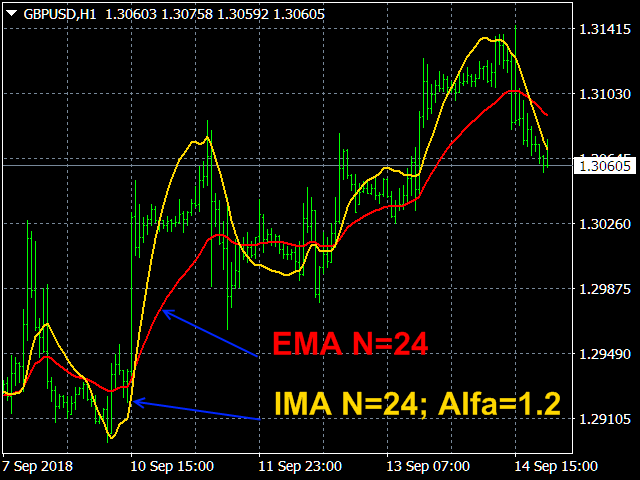
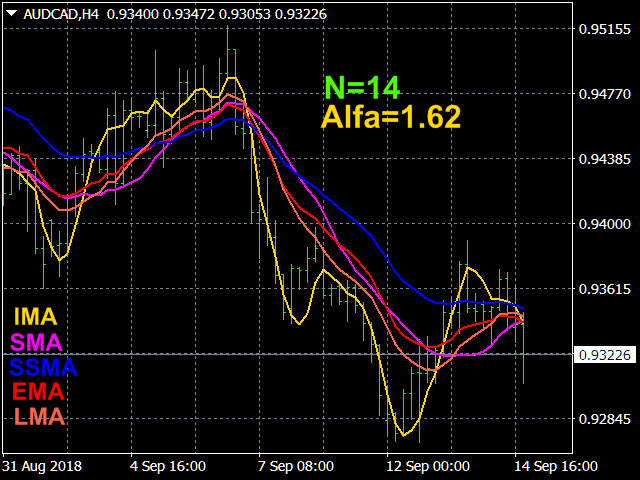
As a result, the time-series points begin to cluster around (on all sides) of the getting IMA and with a smaller delay than around the usual MA. Therefore, IMA is a more effective tool for manual and automatic trading than all types of conventional MA (SMA, EMA, SSMA, LMA). Formulas for IMA are given in the last screenshot.
Indicator Settings.
- Price type . Values: Close price, Open price, High price, Low price, Median price ((high + low)/2 - default), Typical price ((high + low + close)/3), Weighted price ((high + low + 2*close)/4).
- The averaging method . Values: Simple, Exponential (default), Smoothed, Linear weighted .
- The main averaging period . Integer. Default is 14.
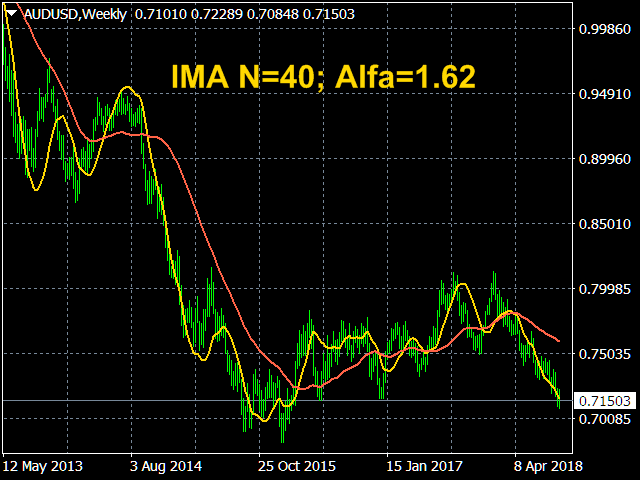
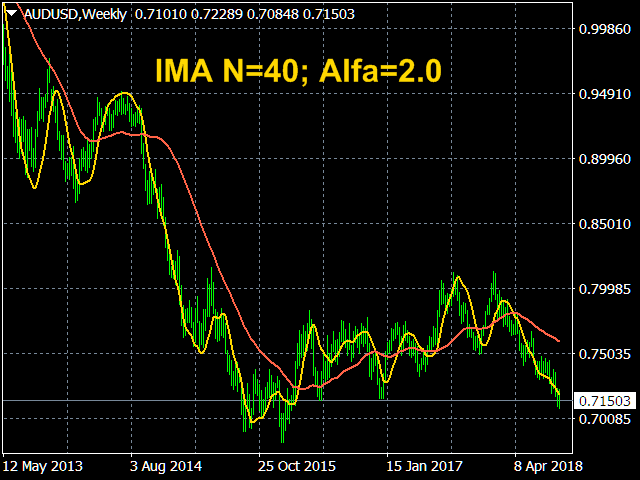
- Coefficient of division of the averaging period . - The coefficient determines the period of the next iteration. Values: any positive real number, which is not zero. Default is 1.62 (Golden Ratio ).
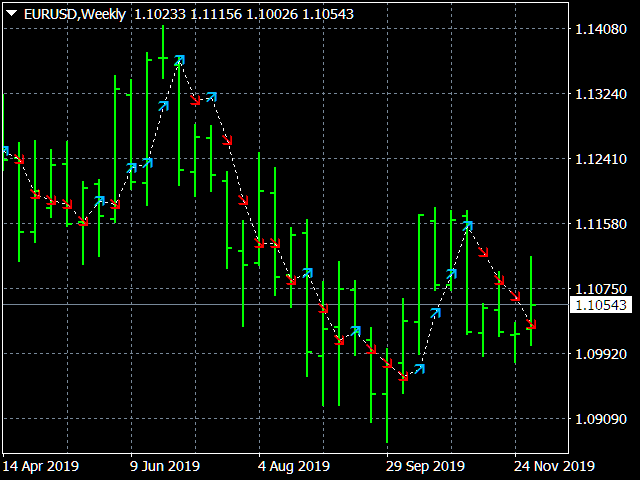
- Dimensions of markers - M arker sizes to display forecast points. Values: any positive integer from 0 to 5 (1 default).
- Show indicator data with arrows; false - line Type of data display. Values: true - arrows , false - line .